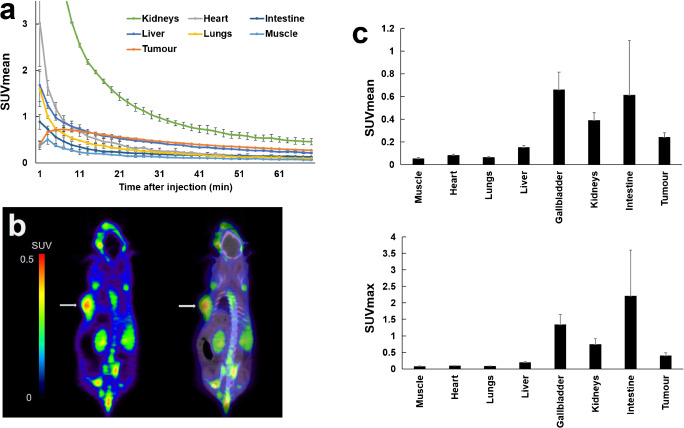
Fig. 1.
a Time-activity curves of [18F]FAPI-74 in PANC-1 tumour and normal organs. b Static coronal PET imaging (left) and PET/CT fusion imaging (right) of [18F]FAPI-74 (1 h post-administration) in PANC-1 xenograft mice. Arrows revealed tumour xenograft on the left side. c The SUVmean (upper) and SUVmax (lower) in the tumour and normal organs. The high uptake by the gallbladder and kidneys was due to the excretion through bile and urine

