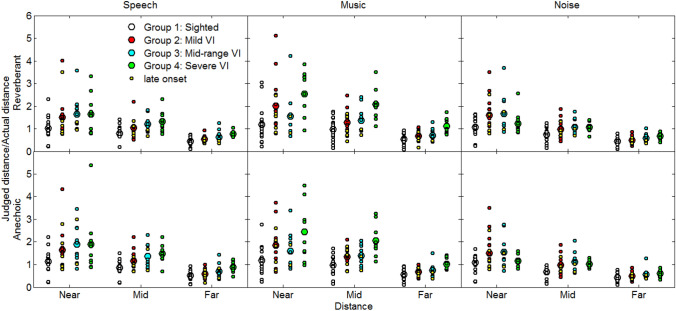
Fig. 4.
Ratio of judged to simulated distances (a measure of accuracy) for normally sighted (white circles), mild VI (red circles), mid-range VI (blue circles) and severe VI (green circles) groups. Large symbols show mean data, and small symbols show individual data. Late-onset VI participants are indicated by small yellow circles. The bottom and top rows show data for the virtual anechoic and reverberant rooms, respectively. The left, middle and right columns show data for speech, music and noise, respectively

