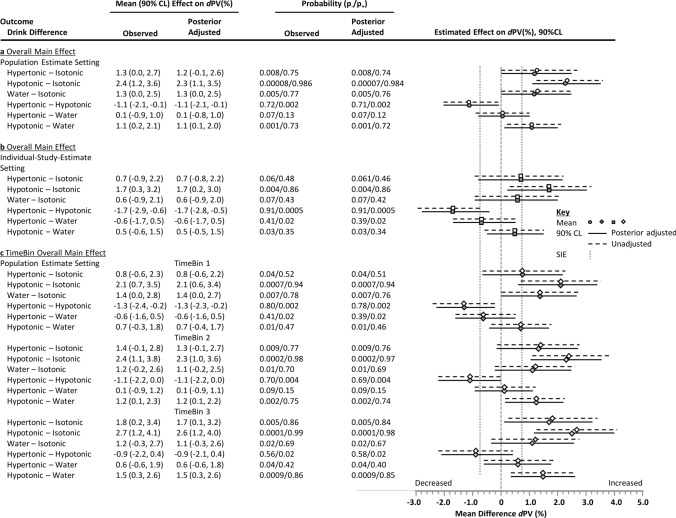
Fig. 4.
Differences in the effect of ingested hypotonic, isotonic and hypertonic drinks and water on delta plasma volume (dPV) during continuous exercise. Data are estimates and 90% compatibility limits (CLs) from the meta-analysis adjusted for metabolic rate and average drink ingestion rate partitioned into the unadjusted data-derived estimate and CL (unfilled symbols, hashed lines), and the posterior estimate and CL incorporating the weakly informative prior (filled symbols, solid lines). Panels include: a the overall effect for the population mean setting; b the overall effect for an individual-study setting (i.e., the fixed effect adjusted for random effects); and c the overall effect for the population mean setting apportioned by TimeBin, where the TimeBins were < 30, 30–63, and 63–180 min. The two directional probabilities were provided based upon the probability that a given drink contrast is compatible with a substantial increasing (p+) or decreasing (p-) effect relative to the smallest important effect (SIE) defined as 0.75% dPV. p-values are rounded to two significant figures relating to probability bins (see Sect. 2). Carbohydrate–electrolyte (CHO-E) drink categories were: hypertonic > 300 mOsmol·kg−1, hypotonic < 275 mOsmol·kg−1, isotonic 275–300 mOsmol·kg−1, water/non-CHO-E solutions < 40 mOsmol·kg−1

