
Fig. 7.
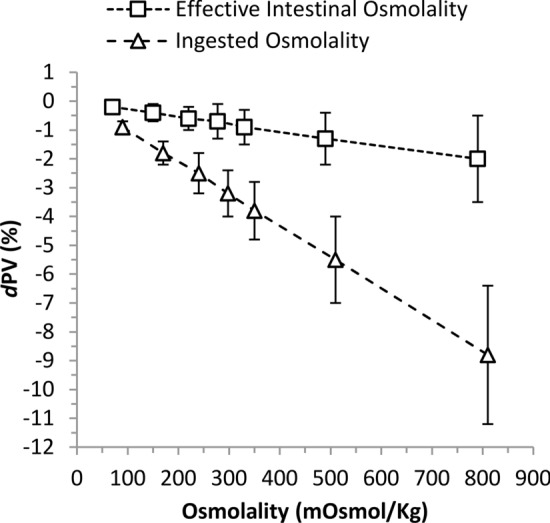
The effect of ingested drink osmolality (∆) and effective intestinal luminal osmolality after carbohydrate disaccharide and polysaccharide hydrolysis (□) on delta plasma volume (dPV). Data are mean estimate and 90% compatibility interval for eight representative levels of osmolality, derived from the random effects model with Treatment*Osmolality the moderator term with adjustment for metabolic rate and average ingestion rate. mOsmol/kg osmolality