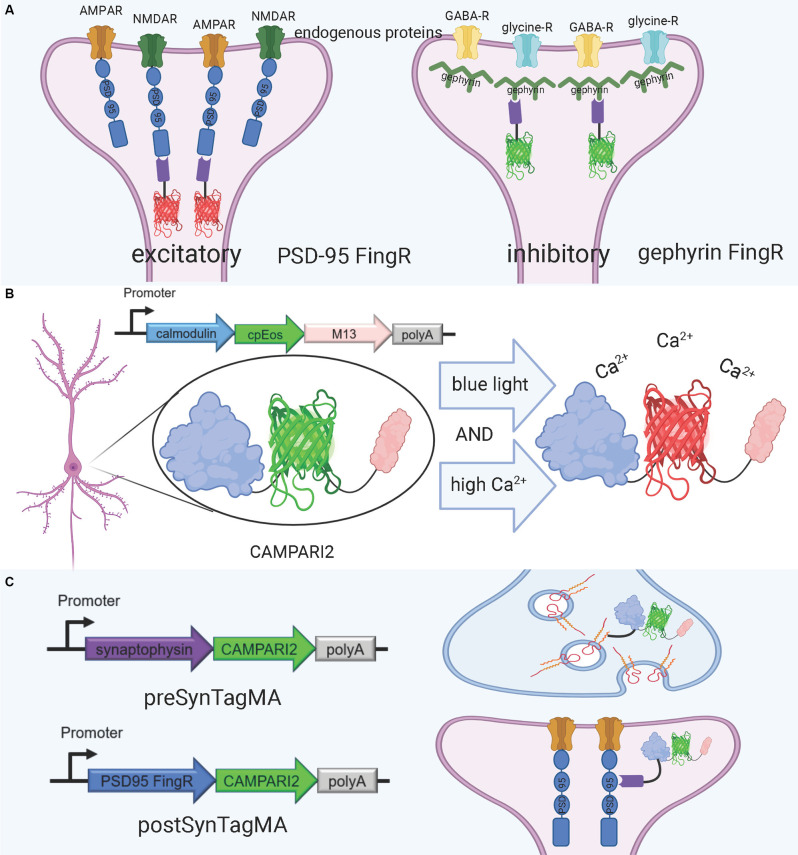
Figure 4.
FingRs and related tools. (A) Schematic diagram of FingRs for post-synaptic labeling of excitatory and inhibitory synapses, using endogenous PSD-95 and gephyrin, respectively. (B) Schematic diagram of CAMPARI2, a genetically encoded calcium indicator, which changes fluorescent wavelength in response to combined blue light and high calcium ion levels. CAMPARI2 forms the fluorescent component of SynTagMA. (C) Schematic diagram of pre-SynTagMA, which marks synaptophysin, and post-SynTagMA, which marks endogenous PSD-95 with the aid of a PSD-95-specific FingR. Created with Biorender.com.

