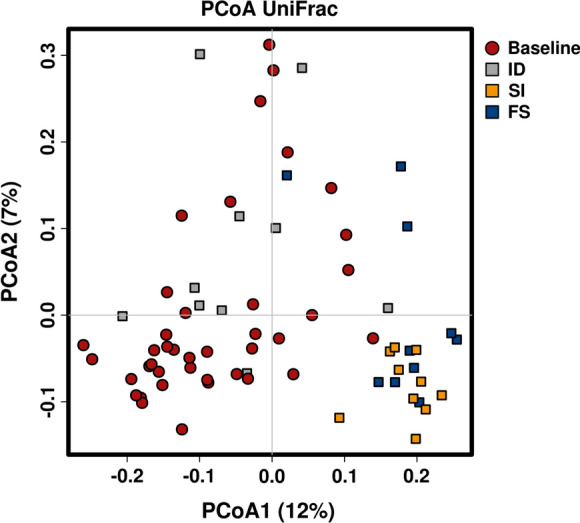
Fig. 3.

PCoA plot of the unifrac distance among the baseline, iron-deficient and iron-rich diets. Gut microbiota was assessed in mice at baseline (red, circle) and after two weeks on an iron-deficient (ID, gray square), Sucrosomial® iron (SI, yellow square) or ferrous sulfate (FS, blue square) diet. Each data point represents a sample. The distance between each sample indicates the dissimilarity between the microbial overall composition. The x-axis describes 12% of the microbial variation and tends to separate mice fed iron-deficient from iron-rich diets
