
Fig. 4.
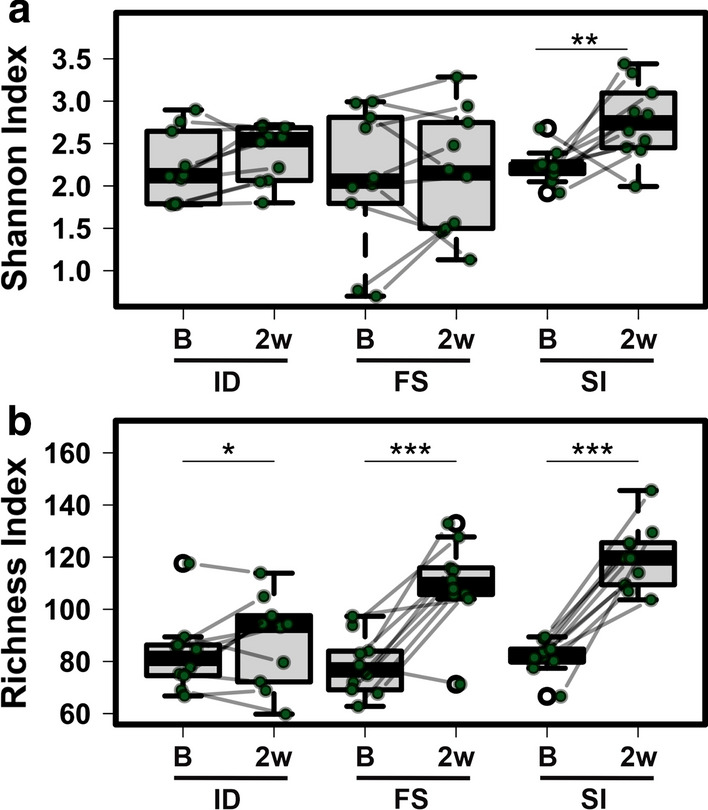
Changes in Shannon diversity and richness in the gut microbiota before and after iron supplementation. Each dot represents the Shannon a index or richness b of a mouse at baseline (B) or 2 weeks after iron supplementation (2w). A line connects the data points for each mouse before and after supplementation. Paired data points are indicated with green circles and outliers with white circles. ID iron-deficient, FS ferrous sulfate, SI Sucrosomial® iron. *P < 0.05, ** P < 0.01, ***P < 0.001