Fig. 3.
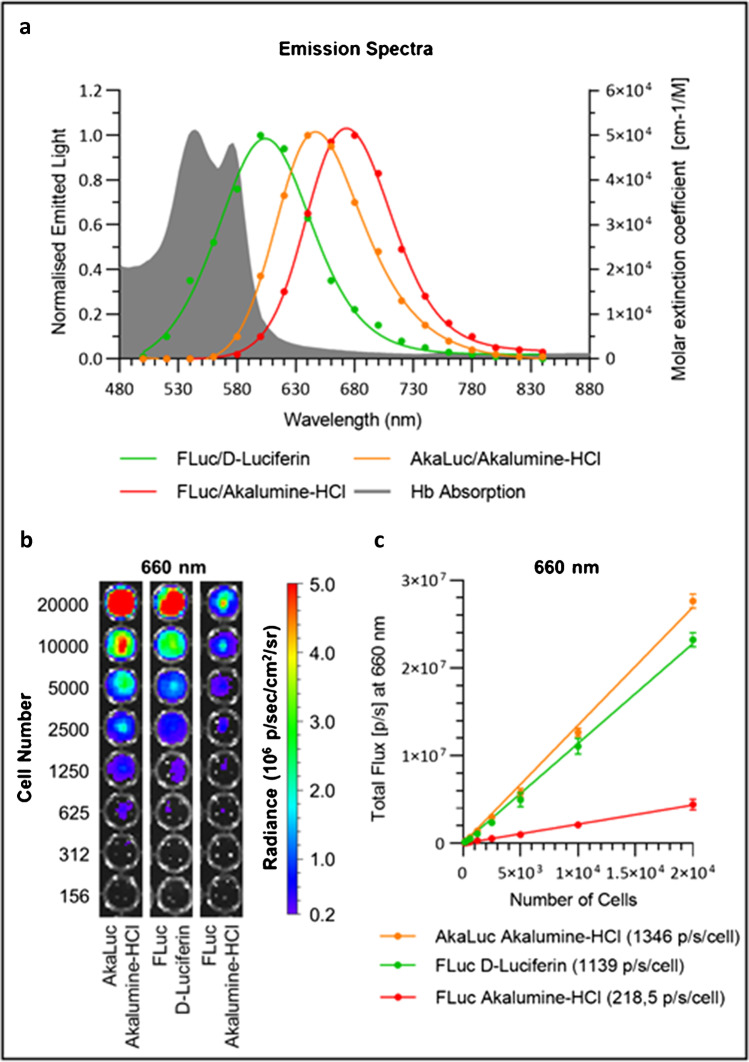
Emission spectra and light output as a function of cell density for the AkaLuc and FLuc reporter systems. a Emission spectrum for each enzyme/substrate pair, as measured by acquiring the signal emitted from 500 to 840 nm at 20 nm steps. Data is normalised to the peak value of each condition. The AkaLuc/Akalumine-HCl system displays a peak at 650 nm, whereas FLuc cells display a peak at 600 nm in the presence of D-Luciferin and 670 nm in the presence of Akalumine-HCl. Haemoglobin (Hb) absorption (average of values of oxy-Hb and deoxy-Hb) is plotted in grey (unit of measure: molar extinction coefficient as shown on the right axis). b, c AkaLuc and FLuc expressing MSCs were seeded at a density of 156 to 2 × 10⁴ cells/well and treated with a saturating concentration of the substrates (160 μM Akalumine-HCl or 5.12 mM D-Luciferin). AkaLuc expressing cells were treated with Akalumine-HCl only, whereas FLuc expressing cells were treated with AkaLuc-HCl or D-Luciferin. The signal was acquired using a 660 nm filter. b Representative images of a well plate immediately after the substrate addition. c Light output (flux) as a function of cell concentration, with linear regression curves. The slope of each curve represents the flux/cell and is shown in the legend. Data are displayed as mean ± SD from n = 3. Acquisition parameters: 13.3 cm FOV, f-stop of 1, binning of 8 and 10 s of exposure

