Fig. 4.
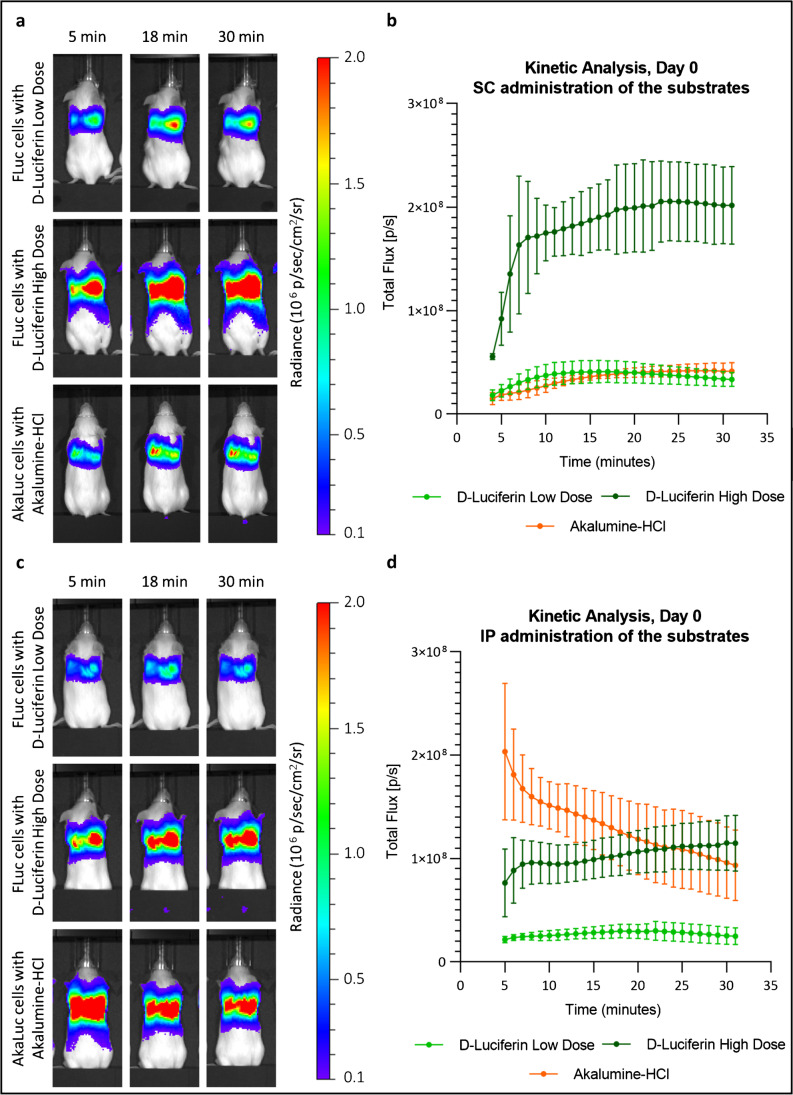
FLuc and AkaLuc systems display similar signal kinetics in vivo when the substrate is administered subcutaneously, but not when administered intraperitonially. MSCs (2.5 × 10⁵) expressing either AkaLuc or FLuc were administered via the tail vein. The mice then received the substrates either subcutaneously or intraperitonially, under the same anaesthesia session, after which they were imaged every minute for 30 min (kinetic analysis). a Representative images of the mice 5, 18 and 30 min post -SC administration of the substrates (radiance scale from 1 × 10⁵ to 2 × 10⁶ p/s/cm2/sr). b Light output (flux) as a function of time, from minute 4 to minute 31. Data are displayed as mean ± SD from n = 3. c Representative images of the mice 5, 18, and 30 min post-IP administration of the substrate (radiance scale from 1 × 10⁵ to 2 × 10⁶ p/s/cm2/sr). d Light output (flux) as a function of time, from minute 5 to 31. Data are displayed as mean ± SD from n = 4. Low-dose D-Luciferin = 0.47 mmol/kg; high dose D-Luciferin = 2.89 mmol/kg; Akalumine HCl = 100 μL of 30 mM solution. Acquisition parameters: no emission filter, 22.8 cm FOV, f-stop of 1, binning of 8 and a maximum exposure of 45 s for each time point

