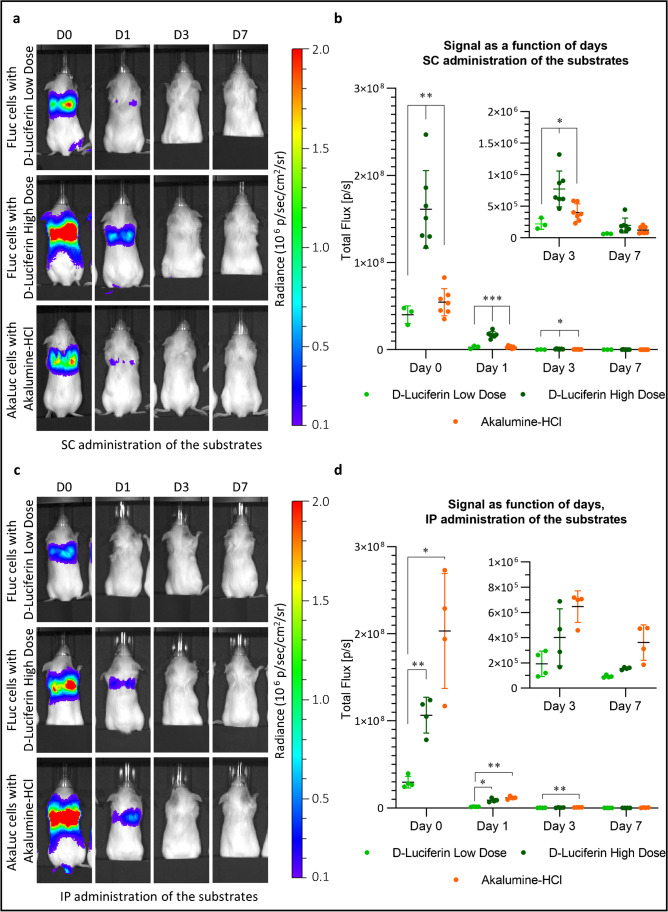
Fig. 5.
The AkaLuc and the FLuc reporter systems display a different sensitivity over time following SC and IP administration of the substrates. UC-MSCs (2.5 × 10⁵) expressing either the FLuc or the AkaLuc transgene were administered via the tail vein and the mice were imaged at day 0 (administration day) and 1, 3, or 7 days post cell administration. D-Luciferin (low or high dose) or Akalumine-HCl were used as substrates and administered either SC or IP. a Representative images of the mice as acquired 20 min post-SC administration of the substrates (radiance scale from 1 × 10⁵ to 2 × 10⁶ p/s/cm2/sr). b Light output (flux) as a function of time (day). Data are displayed as mean ± SD from n = 3 (D-Luciferin low dose), n = 7 (D-Luciferin high dose and Akalumine-HCl). The FLuc reporter in combination with a high dose of D-luciferin yields a stronger signal in all days. c Representative images of the mice acquired at peak signal of each condition (20 min for D-Luciferin and 5 min (for D0) or 4 min (for D1, 3, and 7) for Akalumine-HCl) following IP administration of the substrates (radiance scale from 1 × 10⁵ to 2 × 10⁶ p/s/cm2/sr). d Light output (flux) as a function of time (days). Data are displayed as mean ± SD from n = 4. Statistical analysis was performed using a two-way ANOVA and Tukey’s multiple comparison post hoc test. *p < 0.05; **p < 0.01., ***p < 0.001. Acquisition parameters: no emission filter, 22.8 cm FOV, f-stop of 1 and a binning of 8. FLuc/D-Luciferin exposure time: 45 s for D0 and D1, and 180 s for D3 and D7. AkaLuc/Akalumine-HCl exposure time: 45 s for D0 and 180 s for D1, 3, and 7

