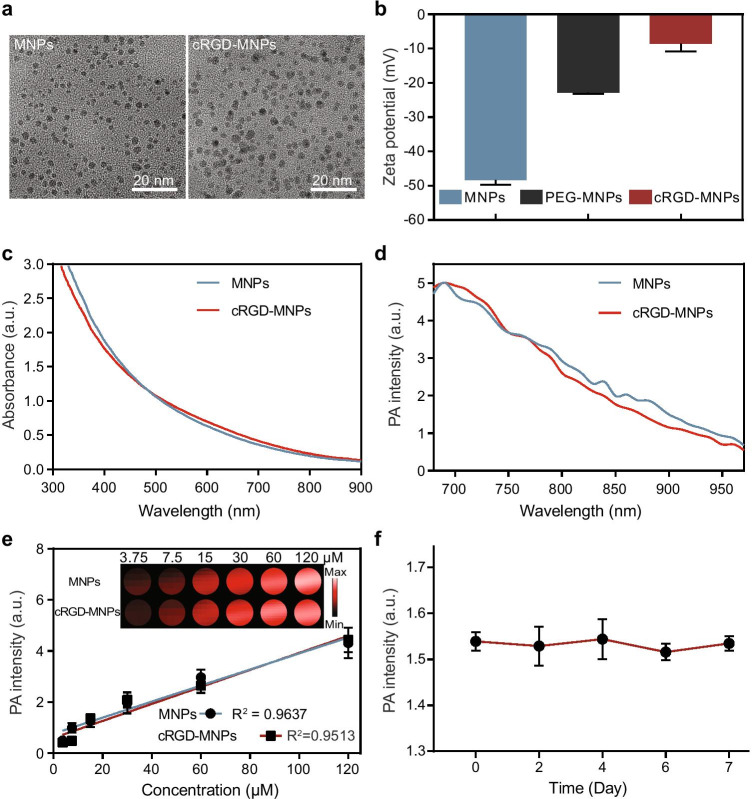
Fig. 1.
Characterisation of cRGD-MNPs. a Representative transmission electron microscopy images of MNPs (left) and cRGD-MNPs (right), scale bar: 20 nm. b Zeta potential of MNPs, PEG-MNPs and cRGD-MNPs in aqueous solution. c UV–vis-NIR spectra of MNPs and cRGD-MNPs. d PA spectra of MNPs and cRGD-MNPs. e The photoacoustic signal produced by MNPs and cRGD-MNPs was linear at concentrations from 3.75 to 120 μM. Upper panel: the original PA image. f PA signal intensities of cRGD-MNPs in PBS (pH = 7.4) stored for 1 week. Data are presented as the mean ± SD (n = 3)

