Figure 2.
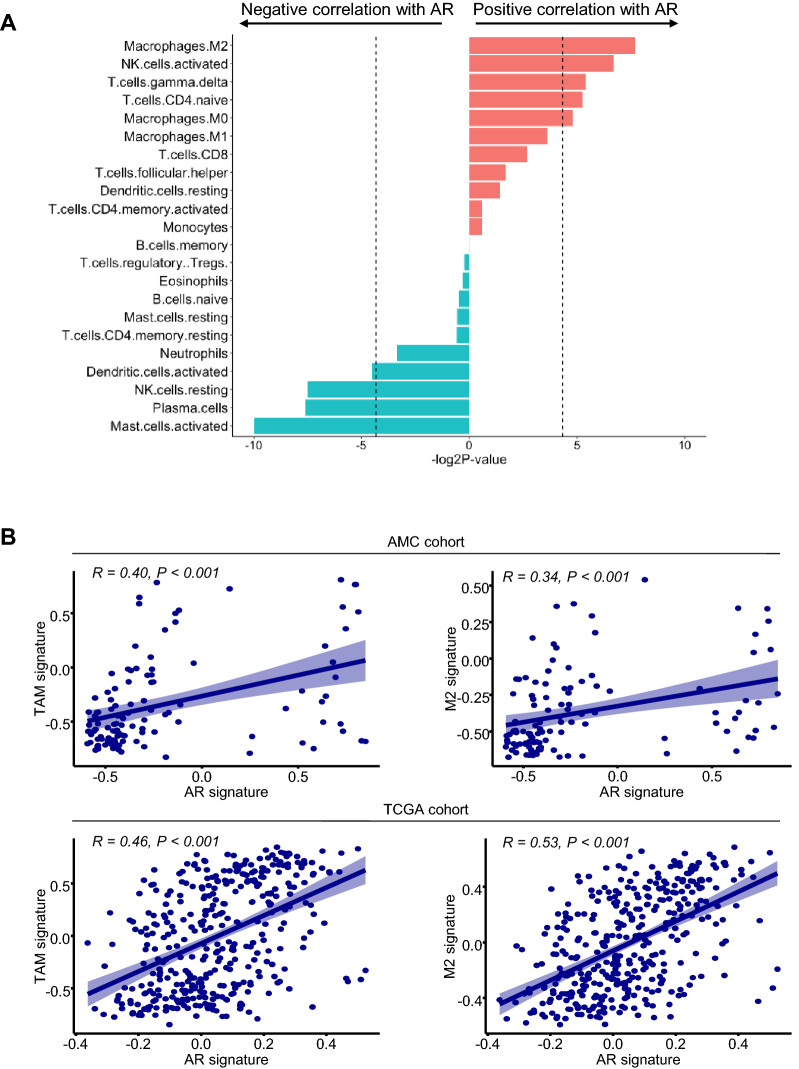
Correlation between the expression levels of the AR signature and M2 macrophage-related parameters. (A) Bar graph showing the correlation between the expression levels of the AR signature represented by the enrichment score calculated by Gene Set Variation Analysis (GSVA) and the abundance of immune subsets estimated by CIBERSORT. (B) Correlation between the expression levels of the AR gene signature and tumor-associated macrophages and M2 macrophage signatures in the study cohort (upper panel) and TCGA cohort (lower panel).

