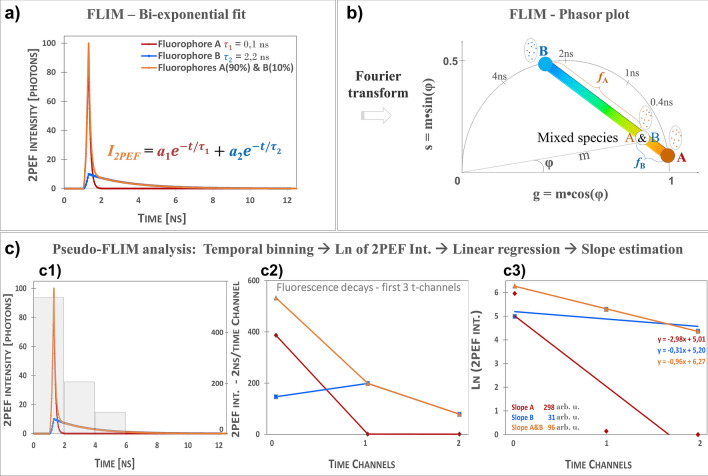
Figure 1.
Principle of FLIM bi-exponential, Phasor and Pseudo-FLIM analyses. (a) Simulated mono-exponential (fluorophores A and B) and bi-exponential (mixed species of fluorophores A and B with respectively 90% and 10% relative contribution) two-photon excited fluorescence intensity decays (12.5 ns time range; 80 MHz); this shape of A&B bi-exponential decay can be measured in melanin containing samples. In FLIM bi-exponential analysis, the 2PEF intensity decay is adjusted with the function in (a) to compute the values of short- and long- fluorescence lifetimes and their relative contributions and . Images of FLIM bi-exponential fit and combination parameters such as amplitude- and intensity-weighted lifetimes are used for data analyses. (b) FLIM phasor analysis transforms a decay into a phasor with polar coordinates g, s, corresponding to the real and complex components of the Fourier transform, that can also be expressed as a function of m modulation and φ phase angle. Mono-exponential decays such as A and B will have their phasors on the semi-circle, whereas mixed species will have a phasor along a line connecting the two distinct lifetime phasors of A and B. The relative fractions and can be computed from the distances of A&B mixed species phasor to B and respectively A phasors. Images of g and s as well as combination parameters such as the apparent phase and modulation lifetimes and their relative fractions are used for data analyses. (c) Pseudo-FLIM analysis firstly involves a temporal binning of the 2PEF decay into a reduced number of time channels with 2 ns integration time per channel (see c1, gray bars indicate the photon intensity of the mixed A&B species within the first 3-time channels with 2 ns binning). The 2PEF intensity of the binned first 3-time channels for simulated A, B and mixed A&B species is given in (c2). After a natural logarithm transformation (c3), a linear regression of the first 3-time channels is performed to calculate the slope of the decay which is multiplied by a − 100 factor to create the Pseudo-FLIM slope parameter. The faster the decay, the higher the slope. Pseudo-FLIM image of the slope parameter is further processed for melanin detection by applying a threshold to keep the pixels with high slope values.

