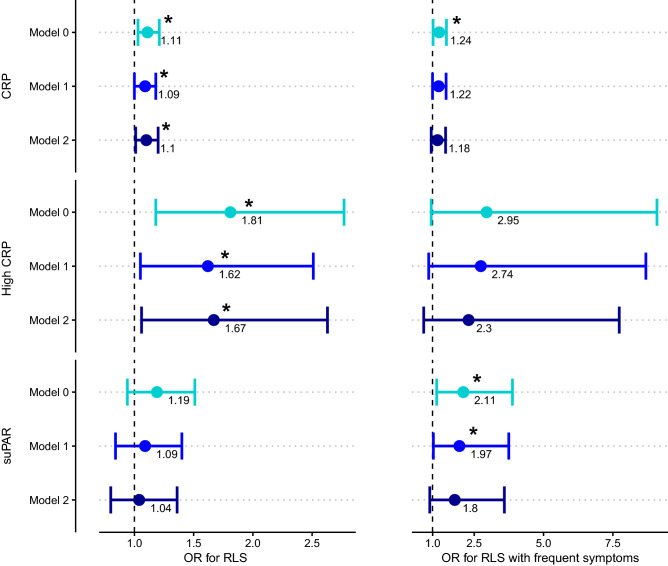
Figure 1.
Chronic inflammation markers and association with RLS. Visualisation of the results from the logistic regression models using CRP levels (top row), CRP as a binary variable (middle row), and suPAR levels (bottom row) as the independent variable and RLS status (left column) or RLS with frequent symptoms (right column) as the dependent variable, using three different models. Model 0 = Crude association. Model 1 = adjusting for sex and age. Model 2 = adjusting for sex, age, smoking status and BMI. Data are presented as odds ratios (OR) with 95% confidence intervals, and an asterisk (*) denotes a P value < 0.05. OR = odds ratio. High CRP is classified as having CRP levels above 3 mg/L but below 10 mg/L.

