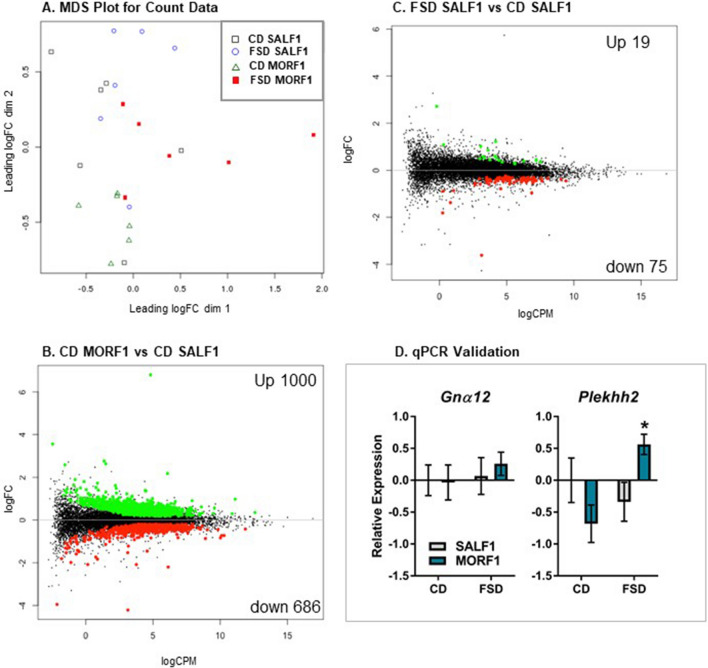
Figure 4.
Panel (A): MDS Plot comparing all groups. Panel (B): Volcano plot of significant differential gene expression when comparing CD maintained MORF1 and SALF1 males. Panel (C): V Volcano plot of significant differential gene expression when comparing FSD maintained SALF1 and CD maintained SALF1 males. Panels (A–C) N = 6/group. Relative expression of Gnα12 (top) and Plekhh2 (bottom) in punch biopsies of liver samples taken after a 24 h fast. SALF1 CD N = 6; SALF1 FSD N = 6; MORF1 CD N = 7; MORF1 FSD N = 7; *p < 0.05 as compared to all other groups.

