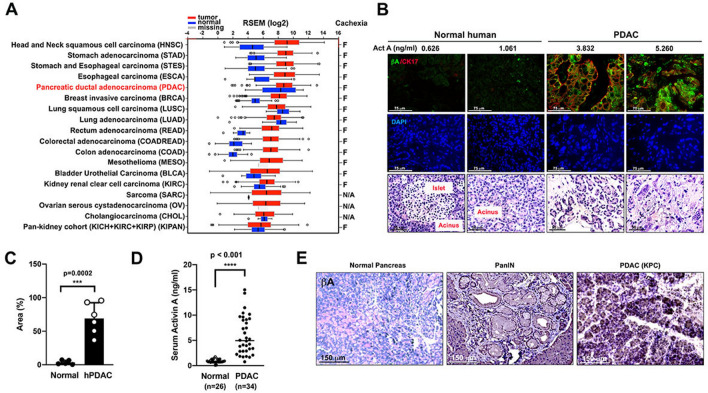
Figure 1.
Activin A is highly expressed in tumor specimens from PDAC patients and enters systemic circulation. (A) Gene expression analysis of INHBA in 18 tumor types of The Cancer Genome Atlas (TCGA) compared with corresponding matched normal (TCGA) tissues using RNA-Seq by Expectation–Maximization (RSEM). Sources for the statistics of cancer cachexia prevalence can be found in Supplemental References. (B) Representative immunofluorescence images of activin A (βA, AF488) and keratin 17 (CK17, AF568) expression in non-cancerous pancreatic tissue and PDAC tumor specimens. Nuclei were stained with DAPI. Scale bar = 75 µm. Corresponding serum activin A levels are indicated in ng/ml. Representative H&E images are displayed on the third row. Scale bar = 50 µm. (C) Area percentage of green pixels indicating activin A expression in immunofluorescence images from non-cancerous pancreatic tissue (n = 5) and PDAC tumor specimens (n = 6). Each dot represents the average green pixel area percentage per image as measured by Image J. (D) Measurement of activin A levels in sera of non-cancer patients (n = 25) and PDAC patients (n = 34). (E) Representative immunohistochemical images of activin A expression in pancreas tissue from healthy control as well as PanIN lesions and tumor specimens from KPC mice.

