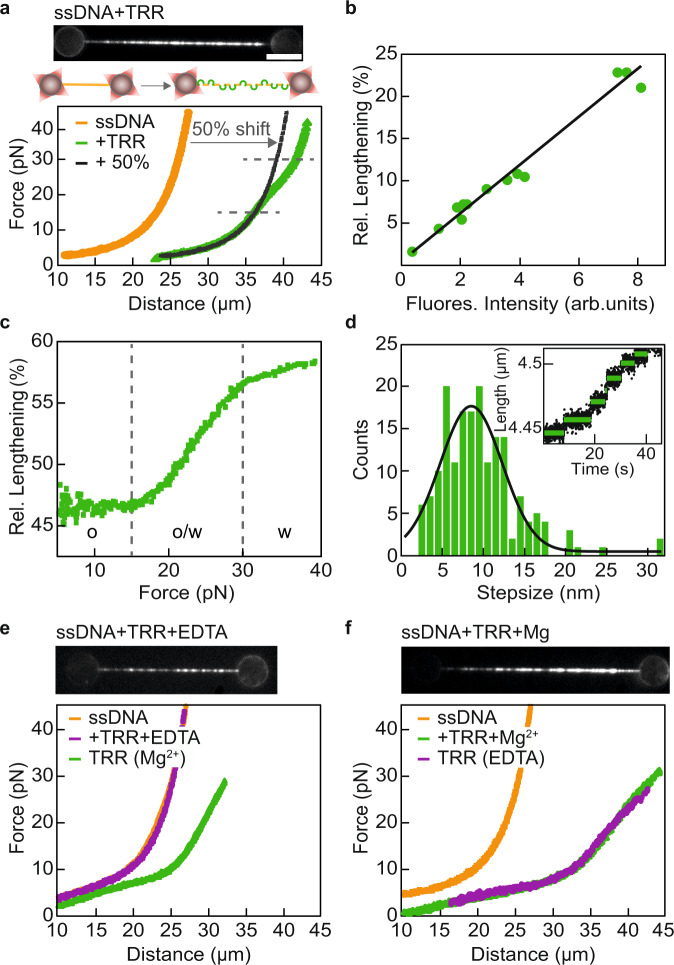
Fig. 2. Direct observation of TRR gate opening on ssDNA.
a (Top) Representative mCherry fluorescence image of TRR-ssDNA. Scale bar represents 5 µm, and applies to all snapshots. (Bottom) Representative FD-curves of bare ssDNA (orange) and TRR-ssDNA (green). The black line shows the FD-curve of ssDNA shifted to a 50% longer contour length, while the dashed grey lines highlight the shoulder in the FD-curve which signifies an additional, force-induced length increase from ~15 to 30 pN. The schematic representation depicts the length increase of ssDNA due to TRR binding and gate opening. Representative data are shown from at least 30 independent measurements. b Relative (rel.) lengthening of ssDNA as a function of mCherry fluorescence (fluores.) intensity from bound TRR, based on at least 10 independent experiments (green), together with a linear fit to the data (black line). c ‘Subtraction plot’ showing the relative lengthening for TRR-ssDNA compared to bare ssDNA as a function of force, based on the data shown in panel (a). Dashed grey lines highlight the transition (o/w) between the open (o) and the widened (w) states of the TRR-ssDNA gate. d Step-size distribution of single gate opening events (green) following TRR-induced cleavage of ssDNA, fitted to a single Gaussian function (black line, based on N = 176; average step size 8.5 ± 3.8 nm; mean ± SD). Inset: Representative length–time trace recorded for ssDNA in the presence of a low concentration (~1 nM) of TRR, measured at a constant force of 15 pN (from six independent measurements). Raw data (black) are shown, together with steps fitted using a step-fitting algorithm (green). e (Top) Representative mCherry fluorescence image (from N ≥ 10) following incubation of a tethered ssDNA substrate in TRR in Mg2+-deficient buffer. (Bottom) Representative FD-curves (from N ≥ 10) of bare ssDNA (orange), TRR-ssDNA in the absence of Mg2+ (purple), and the same TRR-ssDNA molecule after incubation in Mg2+-containing buffer (green). f (Top) Representative mCherry fluorescence image (from N ≥ 15) following incubation of a tethered ssDNA substrate in TRR in standard buffer (i.e., containing Mg2+). (Bottom) Representative FD-curves (from N ≥ 15) of bare ssDNA (orange), TRR-ssDNA in the presence of Mg2+ (green), and the same TRR-ssDNA after incubation in Mg2+-deficient buffer (purple). Source data are provided as a Source Data file.

