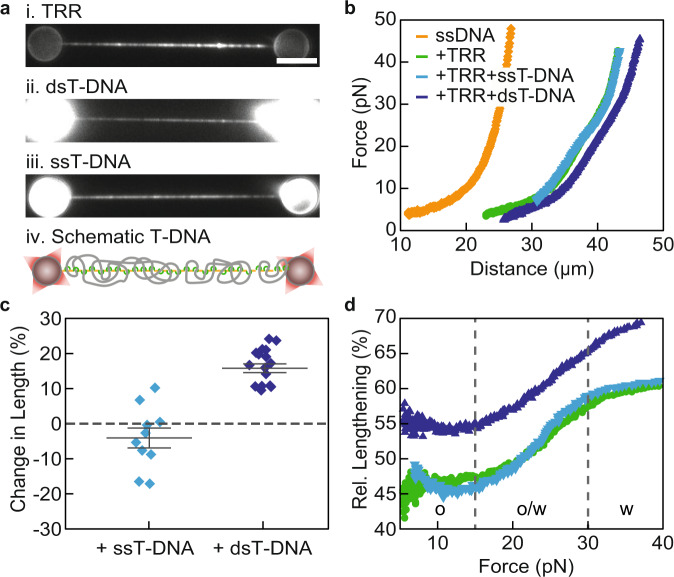
Fig. 3. Direct observation of ds/ssT-DNA binding to TRR-ssDNA.
a Representative fluorescence images (from N ≥ 10) of TRR-ssDNA (i) bound by either dsT-DNA (ii) or ssT-DNA (iii). TRR was visualized using mCherry fluorescence, while dsT- and ssT-DNA were stained with intercalator dye. Note that images i and ii correspond to the same substrate (the TRR-mCherry fluorescence image corresponding to the substrate in iii is not shown). A schematic representation of ssDNA coated with TRR and T-DNA is shown underneath (iv). Scale bar represents 5 µm, and applies to all snapshots. b Representative FD-curves (from N ≥ 10) of bare ssDNA (orange), TRR-ssDNA (green) and TRR-ssDNA bound by either dsT-DNA (dark blue) or ssT-DNA (light blue). c Change in length of TRR-ssDNA (in the force range from 5 to 15 pN) upon binding of either ssT-DNA (light blue, from N ≥ 10) or dsT-DNA (dark blue, from N ≥ 10). Error bars indicate SEM. d ‘Subtraction plots’ showing the relative (rel.) lengthening for TRR-ssDNA (green), and TRR-ssDNA bound by either ssT-DNA (light blue) or dsT-DNA (dark blue) compared to bare ssDNA. Plots were generated using the FD-curves in panel (b). Dashed grey lines highlight the transition (o/w) between the open (o) and the widened (w) states of the TRR-ssDNA gate. Source data are provided as a Source Data file.

