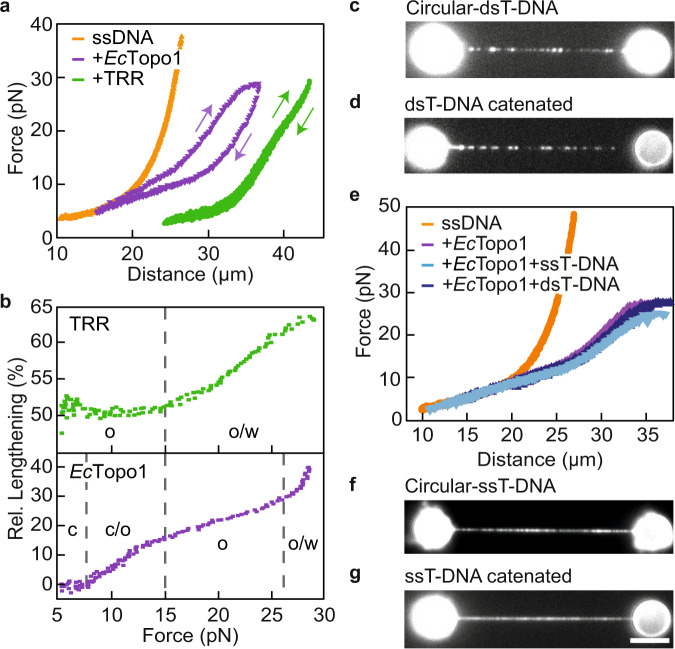
Fig. 5. Binding and catenation of dsT- and ssT-DNA to tethered ssDNA by EcTopoI.
a Representative FD-curves (from N ≥ 30) of bare ssDNA (orange), TRR-ssDNA (green) and EcTopoI-ssDNA (purple). Upwards and downwards arrows indicate extension and retraction curves, respectively. b ‘Subtraction plots’ showing the relative (rel.) lengthening for TRR-coated ssDNA (top, green) and EcTopoI-coated ssDNA (bottom, purple) compared to bare ssDNA. These plots were generated from the FD-curves shown in panel (a). Dashed grey lines highlight the transitions (c/o, o/w) between the closed (c), open (o) and widened (w) states of the topoisomerase-ssDNA gate. c Representative intercalator fluorescence image (from N ≥ 5) of circular dsT-DNA bound to EcTopoI-ssDNA in standard buffer. d Representative intercalator fluorescence image (from N ≥ 5) of circular dsT-DNA obtained after moving the substrate shown in panel (c) into high-salt buffer. e Representative FD-curves (from N ≥ 5) of bare ssDNA (orange), EcTopoI-ssDNA (purple) and EcTopoI-ssDNA in the presence of either ssT-DNA (light blue) or dsT-DNA (dark blue) in standard buffer. f Representative intercalator fluorescence image (from N = 4) of circular ssT-DNA bound to EcTopoI-ssDNA in standard buffer. g Representative intercalator fluorescence image (from N = 4) of circular ssT-DNA catenated around ssDNA obtained after moving the substrate shown in panel (f) into high-salt buffer. Scale bar represents 5 µm, and applies to all snapshots. Source data are provided as a Source Data file.

