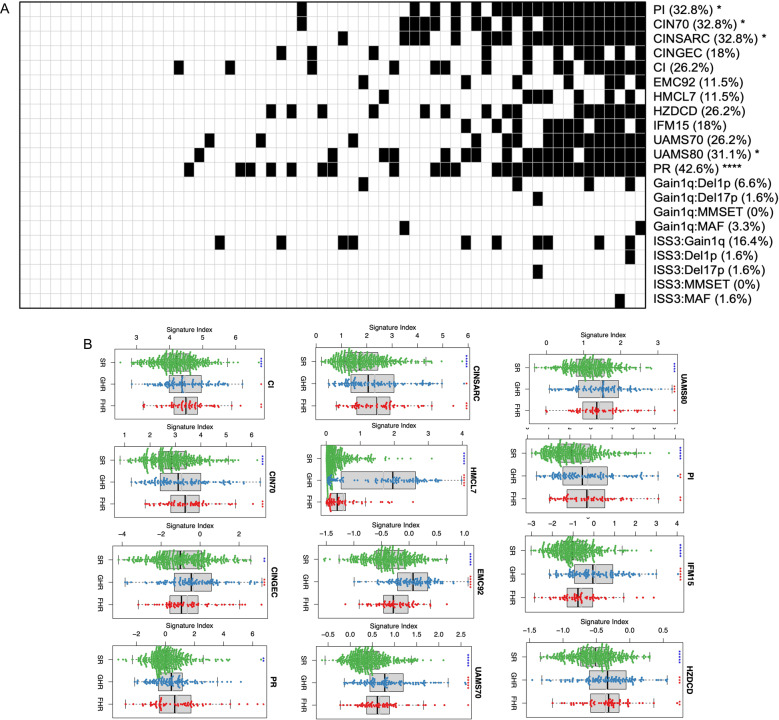
Fig. 2. FHR MM patients and known high-risk signatures.
A Each column indicates individual FHR patient. For gene expression signatures—PI, CIN70, CINSARC, CINGEC, CI, EMC92, HMCL7, HZDCD, IFM15, UAMS70, UAMS80, PR—we arbitrarily set patients with top 20% signature indices as high risk (black square). For other combination high-risk genetic markers—Gain1q:Del1p, Gain1q:Del17p, Gain1q:MMSET, Gain1q:MAF, ISS3:Gain1q, ISS3:Del1p, ISS3:Del17p, ISS3:MMSET, ISS3:MAF—the presence of such combination markers was indicated (black square). Individual genetic markers are as follow: gain1q (gain of 1q), del1p (deletion of 1p), del17p (deletion of 17p), MMSET (dysregulation of MMSET), MAF (dysregulation of MAF/MAFB/MAFC), and ISS3 (ISS stage 3). B Gene expression signature box plots. Symbols above each risk group indicate statistical significance (*: 0.01 < p ≤ 0.05; **: 10−3 < p ≤ 10−2; ***: 10−4 < p ≤ 10−3; ****: 10−5 < p ≤ 10−4; *****: p ≤ 10−5) of comparison between a specific group and all the rest. Symbol colors indicate whether the mean level of a specific group is above (red) or below (blue) that of all the rest.

