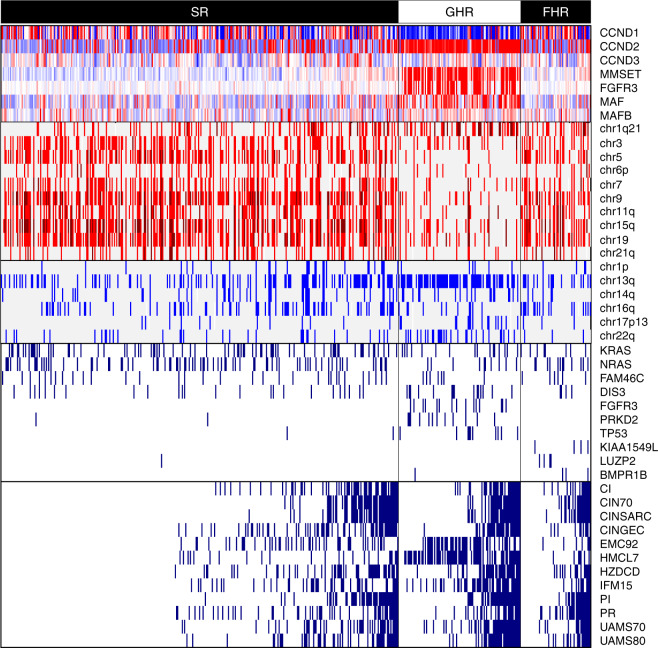
Fig. 3. Composite heat map combining gene expression, copy number aberration, mutation, and gene expression signatures.
Top panel (CCND1, CCND2, CCND3, MMSET, FGFR3, MAF, MAFB) shows the median-normalized gene expression profiles of important TC class marker genes. For each gene, expression above/below the median level is indicated as red/blue, and the median level is indicated as white. The second panel comprises chr1q21, chr3, chr5, chr6p, chr7, chr9, chr11q, chr15q, chr19, chr21q which displays gain of the respective chromosomal regions. Single copy gain is indicated as red and two or more copy gain is indicated as dark red. The GHR group clearly shows the dominance of non-hyperdiploid cases while the SR and FHR groups show prevalence of hyperdiploid cases. The third panel comprises chr1p, chr13q, chr14q, chr16q, chr17p13, chr22q which exhibits loss of respective chromosomal regions. Single copy loss is indicated as blue and two-copy loss is indicated as dark blue. The GHR group clearly shows the dominance of chr13q deletion, possibly indicating the involvement of RB1. The fourth panel comprises KRAS, NRAS, FAM46C, DIS3, FGFR3, PRKD2, TP53, KIAA1549L, LUZP2, and BMPR1B which shows presence of NS mutations for the respective genes. KRAS, NRAS, FAM46C, and DIS3 are known to be frequently mutated in MM. However, FGFR3, PRKD2, and TP53 genes are found to be mutated specifically in the GHR group, while KIAA1549L, LUZP2, and BMPR1B genes are found to be mutated specifically in the FHR group in this study. The bottom panel comprises CI, CIN70, CINSARC, CINGEC, EMC92, HMCL7, HZDCD, IFM15, PI, PR, UAMS70, and UAMS80 which represents gene expression signatures. Here, patients with top 20% respective indices are marked as high-risk.

