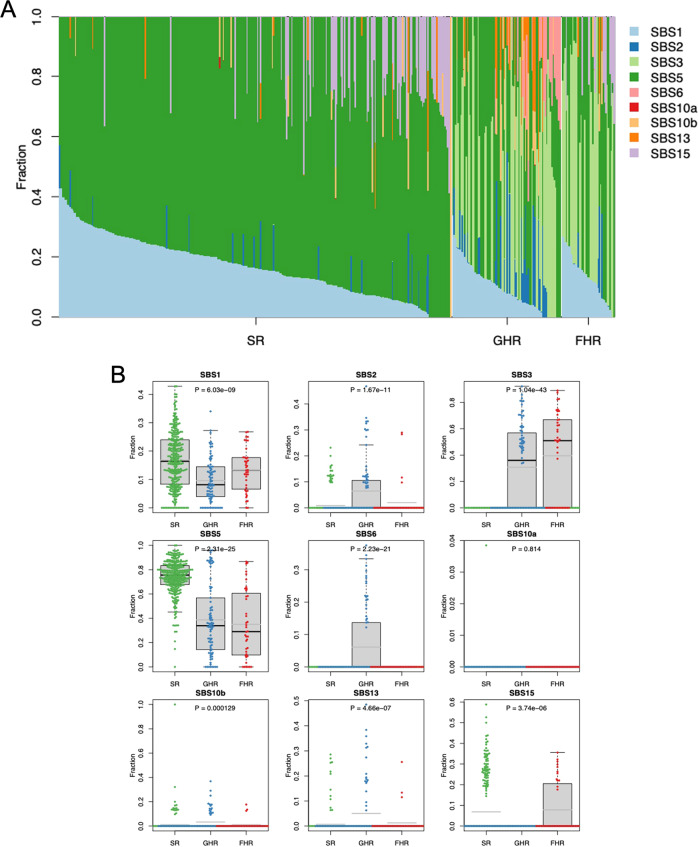
Fig. 4. Mutational Signatures for SR, GHR, and FHR groups.
A For each patient, respective contributions of component MSs are indicated with different color codes. B For individual MSs, respective level of contributions among all MSs per patient are compared among the three risk groups using Kruskal-Wallis test. Here, whether the distribution of respective level of contributions in one risk group is particularly different from those of the other risk groups is tested. SBS5 is more prominent in the SR group than in the GHR and FHR groups (p = 2.31 × 10⁻²⁵), while SBS3 is more prominent in the GHR and FHR groups (p = 1.04 × 10−43) . SBS2 (p = 1.67 × 10⁻¹¹) and SBS6 (p = 2.23 × 10⁻²¹) are more prominent in the GHR group.

