Figure 1.
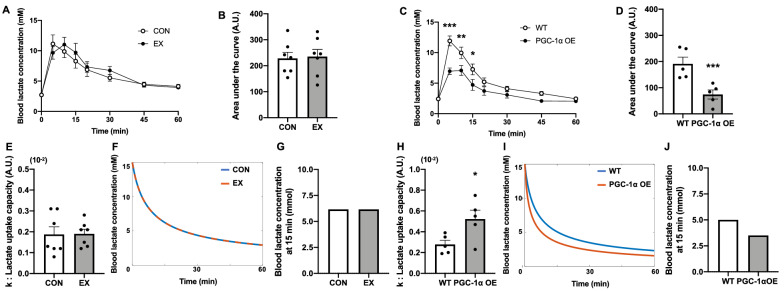
Effects of endurance exercise training and PGC-1α overexpression on lactate uptake capacity. Time course and area under the curve of blood lactate concentration during lactate tolerance test after 6 weeks of endurance exercise training (A, B) and skeletal muscle-specific PGC-1α overexpression (C, D). The values of k, which indicate lactate uptake capacity (E, H). Simulation of blood lactate concentration decay from 15 mM using the mean values of k in each group (F, I) and simulated blood lactate concentration at 15 min (G, J). Data are expressed as mean ± SEM. n = 7 in the CON and EX groups. n = 5 in the WT and PGC-1α OE groups. *P < 0.05, **P < 0.01, ***P < 0.001.

