
FIGURE 2.
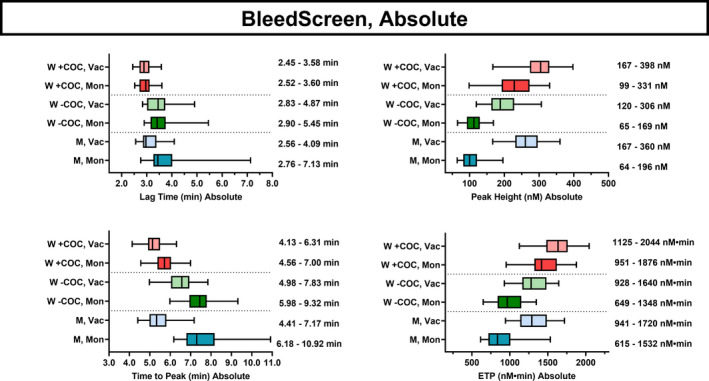
Reference intervals for the absolute values for women (W) taking COCs, women not taking COCs, and men (M) sampled in the tubes Monovette (Mon) or Vacutainer (Vac) tubes and measured using the Bleedscreen reagent. Each line shows the 95% central values, whereas the bars indicate the 50% central values and the median for lagtime, peak, ttPeak, and ETP. The values are shown to the right of each group. COCs, combined oral contraceptives; ttPeak, time to peak; ETP, endogenous thrombin potential