Figure 1.
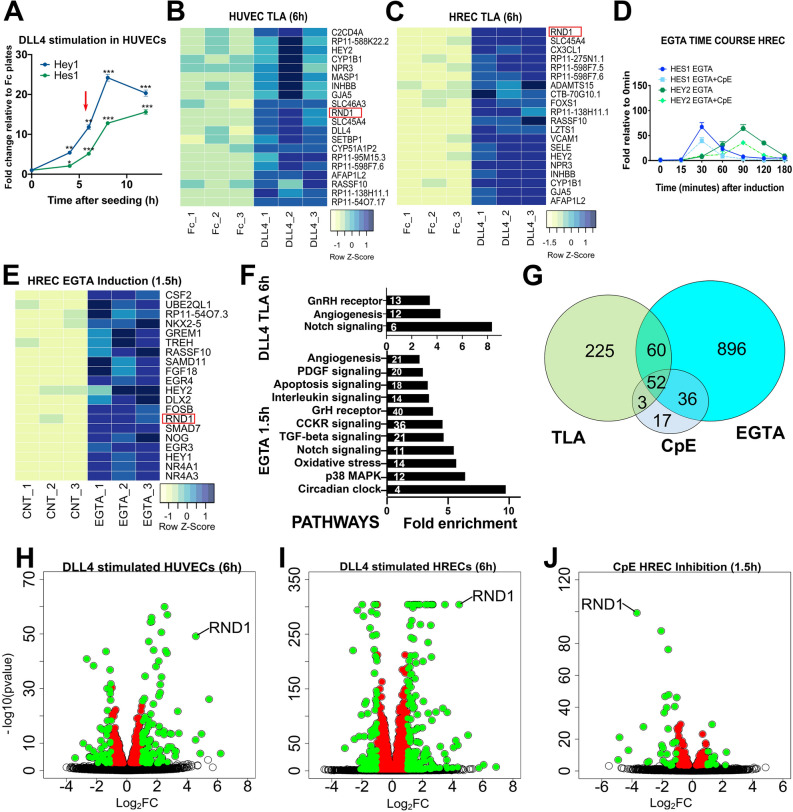
Ligand Notch activation rapidly induces known and novel targets including RND1 in endothelial cells. (A) Time course of induction after seeding HUVEC onto DLL4-Fc coated plates as compared to Fc coated control plates (TLA assay). Robust activation of expression of known direct Notch targets was achieved as early as 6 h (red arrowhead). Single, double, and triple asterisks indicate p values of < 0.05 (*), < 0.01 (**), and < 0.001 (***), respectively, in all panels. (B–C) The 20 genes with the highest average fold induction in HUVEC (B) or HREC (C) by DLL4 TLA after 6 h. All heatmaps indicate z-score (standard deviations from the mean). RND1 is among the most significantly regulated Notch targets in both EC cell types. Red rectangle indicates RND1 in all heatmaps. (D) Induction time course of known Notch targets in HREC after 15 min of EGTA treatment or treatment with both EGTA and CpE. Robust activation of known direct Notch targets occurs between 30 and 90 min (0.5–1.5 h). (E) Heatmap of the 20 genes most highly upregulated by EGTA induction in HREC within 1.5 h shows that RND1 is rapidly significantly upregulated within the same timeframe as known direct Notch targets. (F) GO pathways significantly enriched in the 340 genes significantly upregulated by DLL4 TLA induction in both HUVEC and HREC (top) or the 1,105 genes significantly upregulated by EGTA (bottom). Inset indicates number of significantly regulated genes contributing to each pathway. The Notch signaling pathway was significantly regulated in both contexts. (G) Overlap between genes significantly upregulated by DLL4 TLA induction in both HUVEC and HREC, genes induced by EGTA, and genes repressed by CpE. (H–J) Volcano plots of gene expression changes in DLL4-stimulated HUVEC, DLL4-stimulated HREC, and CpE-inhibited EGTA-stimulated HREC (left to right, respectively). Uncolored circles indicate padj > 0.05, colored circles indicate padj < 0.05, red circles = fold change (FC) <|1.2|, green circles = FC >|1.2|.

