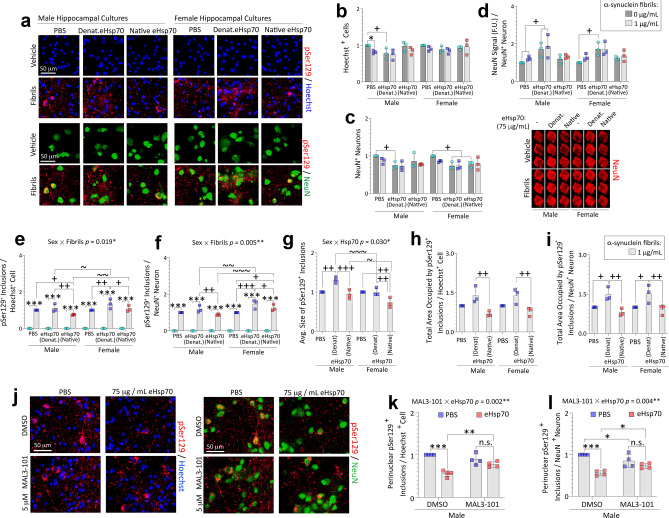
Fig. 5.
Treatment with eHsp70 reduces pSer129+ inclusions in male and female primary hippocampal cultures challenged with preformed α-synuclein fibrils. Primary hippocampal cultures harvested from male vs. female rat pups were exposed to 1 μg/mL α-synuclein fibrils for 10 days. In parallel, cells were also exposed to vehicle and 75 µg/mL denatured eHsp70 (both as controls) or to 75 µg/mL of native eHsp70 (a–i). a Representative photomontage of pSer129+ inclusions, NeuN+ neurons, and Hoechst-stained nuclei corresponding to data in b–i. Blinded measurements of Hoechst+ cells (b) and NeuN+ neurons (c). Levels of NeuN signal (per In-Cell Western analyses) were expressed as a fraction of NeuN+ neuron counts in the same wells in d to display lability of the NeuN marker. Numbers of pSer129+ inclusions expressed as a fraction of Hoechst+ cells (e) or NeuN+ neurons (f). The average inclusion size is shown in g. The total area occupied by the inclusions expressed as a fraction of Hoechst+ cells (h) or NeuN+ neuron numbers (i). Significant intervariable statistical interactions with biological sex are shown above graphs in e–g. j–l Primary hippocampal neuron cultures harvested from male rat pups were exposed to 1 μg/mL α-synuclein fibrils for 10 days. In parallel, cells were also exposed to 75 µg/mL of native eHsp70 or 5 µM MAL3-101. j Representative photomontage of pSer129+ inclusions, NeuN+ neurons, and Hoechst-stained nuclei corresponding to data in k–l. Blinded measurements of numbers of perinuclear inclusions expressed as a fraction of Hoechst+ cells (k) or NeuN+ neuron numbers (l). Significant intervariable interactions above k–l show that MAL3-101 modifies the impact of eHsp70 on the numbers of perinuclear inclusions. Shown are the mean + SD of 3–4 independent experiments, each performed in duplicate or triplicate wells. For panels b–i: * p ≤ 0.05, *** p ≤ 0.001 for 0 vs. 1 μg/mL α-synuclein fibrils; + p ≤ 0.05, + + p ≤ 0.01, + + + p ≤ 0.001 for indicated comparison versus denatured eHsp70; ~ p ≤ 0.05, ~ ~ p ≤ 0.01, ~ ~ ~ p ≤ 0.001 for male vs. female cells, two or three-way ANOVA followed by Bonferroni post hoc. For panels k-l: * p ≤ 0.05, ** p ≤ 0.01, *** p ≤ 0.001, two-way ANOVA followed by Bonferroni post hoc

