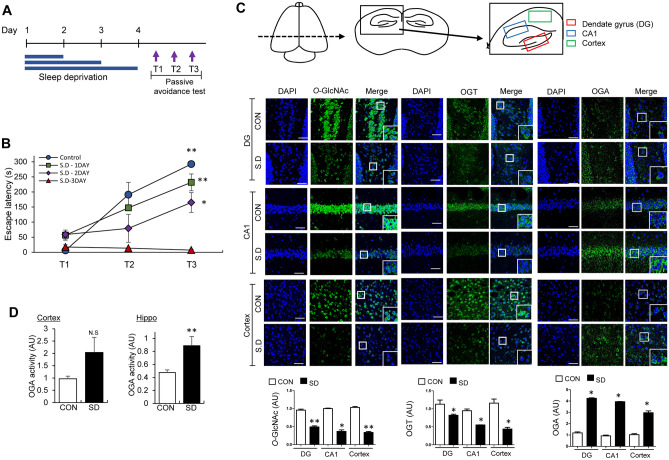
Fig. 1.
REM sleep deprivation (REMSD)-induced changes in learning/memory (L/M) function and O-GlcNAc, OGT and OGA levels in mouse brain. A Schematic experimental design of REMSD and the passive avoidance test. Using the modified multiple platform method, REMSD was induced in mice for 24, 48, or 72 h. Learning and contextual fear memory (T1, T2, and T3) was measured via electric shock (fear conditioning) with 1-h intervals between tests. B Graph depicting retention times after first (T1), second (T2), and third (T3) electric stimulation in control, 24 (1 day), 48 (2 day), and 72 h (3 day) REM sleep-deprived (SD) mice (n = 8/group). C Representative confocal microscopy images (× 40) of O-GlcNAc (green), OGT (green), OGA (green), and merged immunofluorescence staining of dentate gyrus (DG), CA1, and cortex (Fig. 1C illustrations) of mouse brain at 72 h REMSD. Nuclei were counterstained with DAPI (blue). Enlarged images are presented in the white boxes. Scale bar = 50 μm. Graphs represent densitometric quantification of O-GlcNAc, OGT, and OGA (n = 4 ~ 12/group). D OGA enzymatic activity from total lysates of hippocampus and cortex. Absorbance values are presented as fold change relative to the control group (n = 3/group). All values are expressed as mean ± SEM. Student’s t test was used for statistical analysis; *p < 0.05, **p < 0.01 vs control group; N.S., not significant

