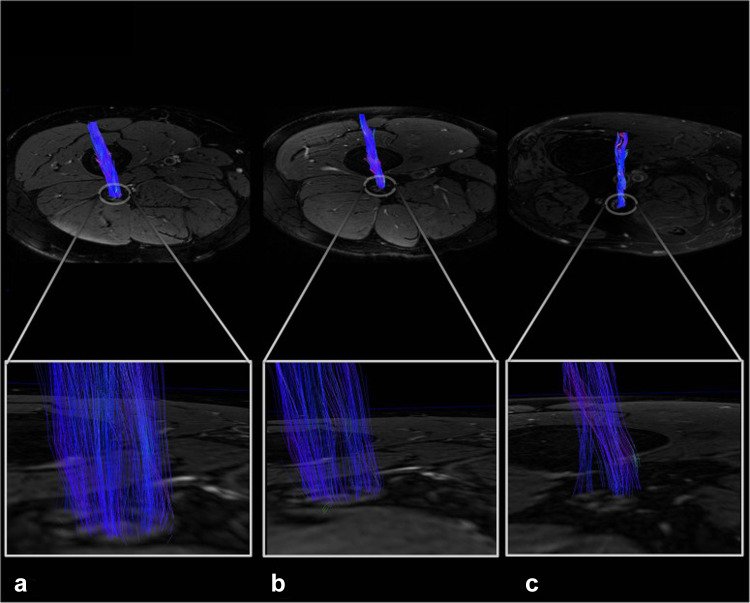
Fig. 5.
Representative sciatic nerve fiber tracts. Reconstructed, 3-dimensional fiber tracts of the sciatic nerve with color encoding according to the DTI eigenvector color map where voxel color reflects the direction of the diffusion tensor in that voxel and intensities are scaled with the FA. Nerve fiber tracts in the control are dense and contiguous (A), which decreases already in the patient with prediabetes (B), and even more in the patient with DPN (C). From Jende et al. [115] under the Creative Commons Attribution license

