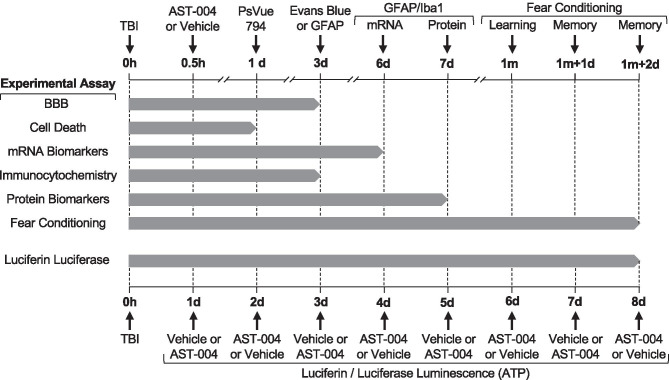
Fig. 1.
Gantt chart showing the timing of all experimental procedures, manipulations, and tests. Experimental assays for all the data presented in the figures for this study are listed in the left column. The timing of the procedures and measurements for each assay is indicated by the vertical-labeled arrows along the top horizontal axis. Note the top axis is interrupted at multiple points to show the time scale in hours (h), days (d), and months (m). The duration of each experimental assay is indicated by the length of the horizontal gray bars. The timing for luciferin/luciferase luminescence measurements is presented on the lower horizontal axis in days (d) post-TBI at 0 h. The duration of these experiments was 8 days, indicated by the horizontal gray bar. Note luminescence measurements alternated between vehicle and AST-004 in 24 h cycles

