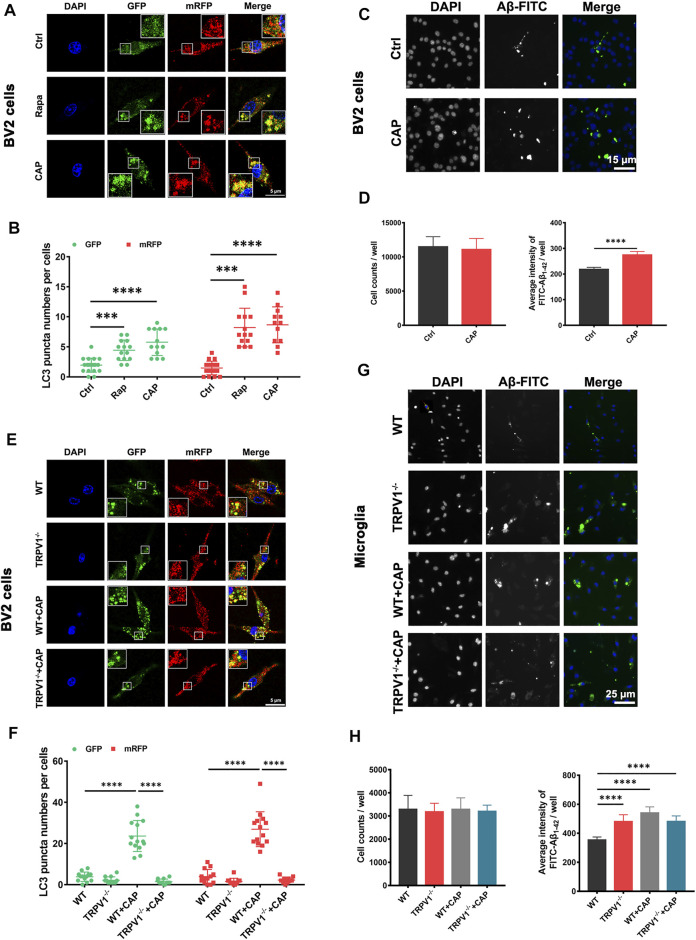
FIGURE 2.
TRPV1 activation promotes autophagic flux and phagocytic capacity in microglia. (A, B, E, F) BV2 cells and primary microglia were transfected with mRFP-GFP-LC3 plasmids for 48 h. Representative confocal images of mRFP-GFP-LC3 location, the number of autophagosome dots (green), autolysosome and autolysosome dots (red) in BV2 cells (A, B) (n = 3, three independent experiments) and primary microglia (E, F) (n = 3, three independent experiments) after treated with 10 μM capsaicin or 2 μM rapamycin for 24 h. (C, D, G, H) Measurement of Aβ phagocytic capacity in BV2 cells or primary microglia. FITC-Aβ1-42 were added to the cells after incubated with 10 μM capsaicin for 24 h. Representative image (C, G) (n = 6, three independent experiments) and quantification of phagocytic capacity. (D, H) (n = 6, three independent experiments) using Cellomics KineticScan reader. Data are representative of three experiments. *** p < 0.0001, **** p < 0.0001, one-way ANOVA with the Tukey’s post-hoc test. Bars represent mean ± SEM. Scale bar for Panel (A, E): 20 μm. Scale bar for Panel (C): 15 μm. Scale bar for Panel (G): 25 μm.

