FIGURE 3.
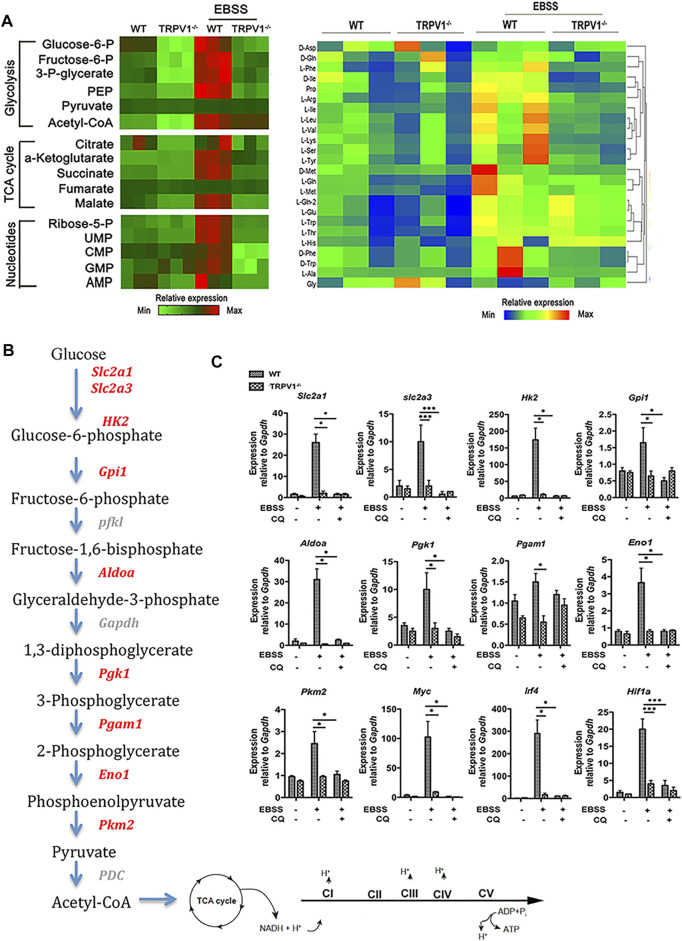
TRPV1 deficiency curtails energy metabolism in microglia via autophagy inhibition. (A) Analysis of polar metabolites including glycolytic, TCA-cycle intermediates, nucleotides, and amino acids by liquid chromatography–mass spectrometry in EBSS-stimulated autophagy of WT and TRPV1−/− microglia. Heatmaps show relative metabolite concentrations per row in microglia repeated in triplicate. (B, C) TRPV1 regulates expression of glycolytic and mitochondrial enzymes. (B) Pathway map of glycolytic enzymes and the electron transport chain in mitochondria. (C) Expression of glycolytic enzymes and transcriptional regulators of glycolysis by real time-PCR in WT and TRPV1−/− microglia before and 24 h after EBSS-stimulated autophagy in the presence or absence of 10 µM chloroquine (n = 3, three experiments). * p < 0.05, *** p < 0.001; one-way ANOVA with the Tukey’s post-hoc test. Bars represent mean ± SEM. CQ, chloroquine.

