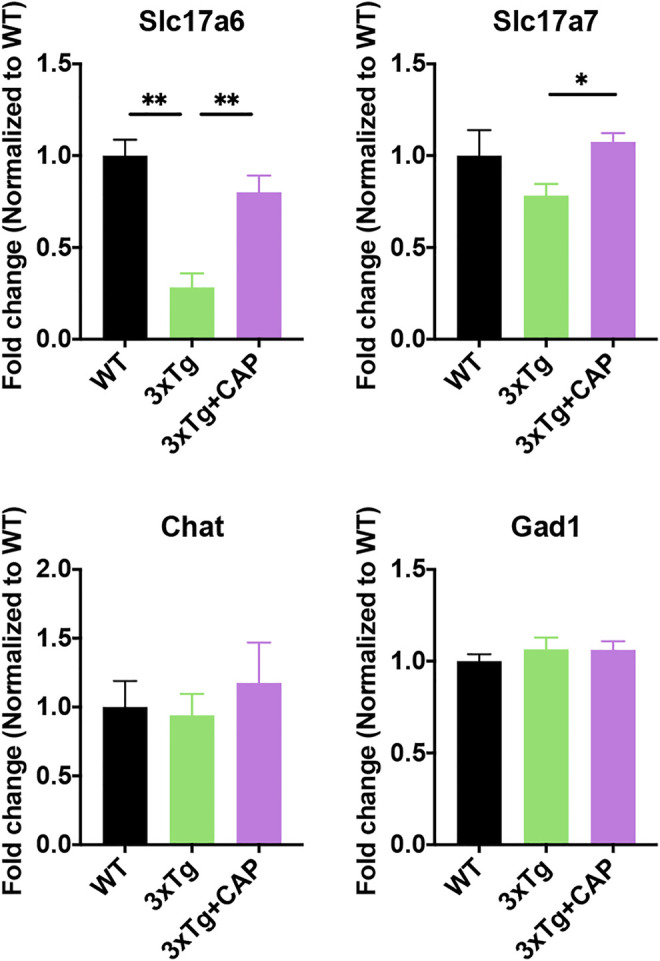
FIGURE 8.

TRPV1 activation rescued microglial neuroimmune suppression in 3xTg mice. (A, B) Histograms depicted quantitative analysis of average branch length (A) and number of end-point voxels (B) of Iba-1+ microglia. (C) Heatmap represented 320 differentially expressed microglial neuroimmune genes. (D) Z-score of genes from neuroimmune suppression cluster for all groups. (E) Histogram depicted top differentially expressed neuroimmune suppression cluster genes from the heatmap (criteria: p value of 3xTg and 3xTg + capsaicin low to high). n = 3 mice in each group. Data are presented as mean ± SEM, * p < 0.05, ** p < 0.001, **** p < 0.0001. Statistical tests: one-way ANOVA with Tukey’s multiple comparison test.
