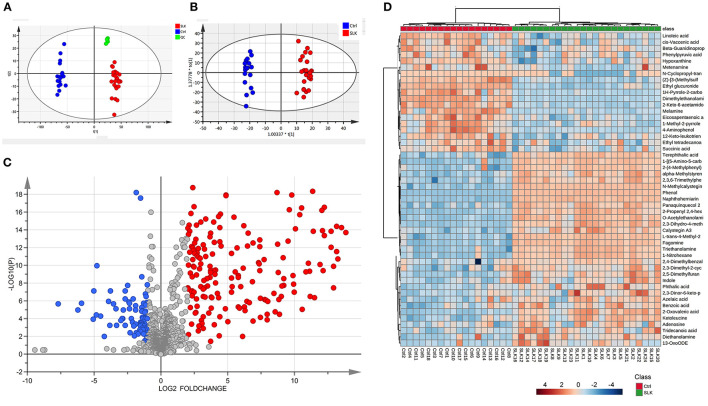
Figure 1.
Metabolomics analysis of tear samples from patients with superior limbic keratoconjunctivitis (SLK) compared with the controls (Ctrl). (A) Principal component analysis (PCA) score plots of Ctrl (blue), SLK (red), and quality control (QC, green). The X-axis (t[1]) and Y-axis (t[2]) indicate the first and second principal components, respectively. (B) Orthogonal projections to latent structures-discriminate analysis (OPLS-DA) score plots for the Ctrl (blue) and SLK (red) groups. The X-axis (t[1]) and Y-axis (to[1]) indicate the predictive and orthogonal directions, respectively. (C) Volcano plots highlighting the tear metabolites that increased (red) or decreased (blue) in SLK tear fluids compared to the control group, with p < 0.05, log2FC >1 or < -1. (D) Hierarchical cluster analysis and heatmap of the differentially expressed metabolites from the SLK and Ctrl groups. The color code in the heatmap represents the relative metabolite abundance: red and blue colors indicate increased and decreased levels of each metabolite in the SLK group versus the Ctrl group, respectively.

