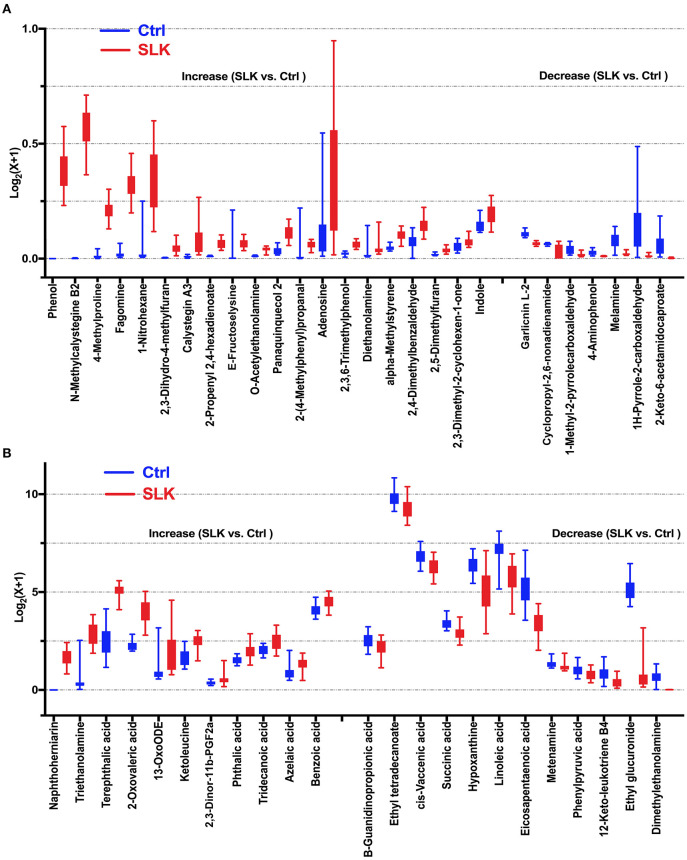
Figure 2.
Boxplots show significantly altered metabolites in the tears of SLK patients. Compared with Control subjects, 19 decreased metabolites and 31 increased metabolites represented by relative expression in the boxplot (SLK vs. Ctrl: P < 0.05). Specifically, for better visualization of box plots in this analysis, the expressions of the metabolites was converted into log2(x + 1) values and a different Y-axis scales and range were applied in (A,B). (A) Metabolites with maximum converted values less than 1 [log2(x + 1) ≤ 1], (B) Metabolites with maximum converted values more than 1 [log2(x + 1) > 1]. Both figures present increased metabolites in the left [20 in (A), 11 in (B)] and decreased metabolites in the right [7 in (A), 12 in (B)], separated by two tick intervals.

