
Figure 3.
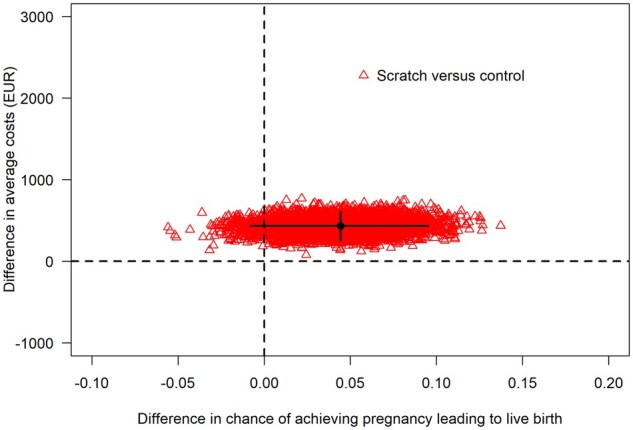
Cost-effectiveness acceptability plane of the chance of pregnancy leading to live birth from the 2nd fresh IVF/ICSI treatment. The red triangles are the differences between scratch and control in the chance of achieving a live birth and the difference in average costs from individual bootstrap samples. The black lines indicate the 95% CI for these differences. The black dot represents the point estimate for the averages that is used to calculate the point estimate for the ICER. The spread of the triangles indicates the uncertainty around the differences in live birth and costs, and thus, in the ICER. Although scratching was more expensive than control in all bootstrap samples, this did not always yield a positive difference in the chance of achieving a live birth. EUR, European euro (€).