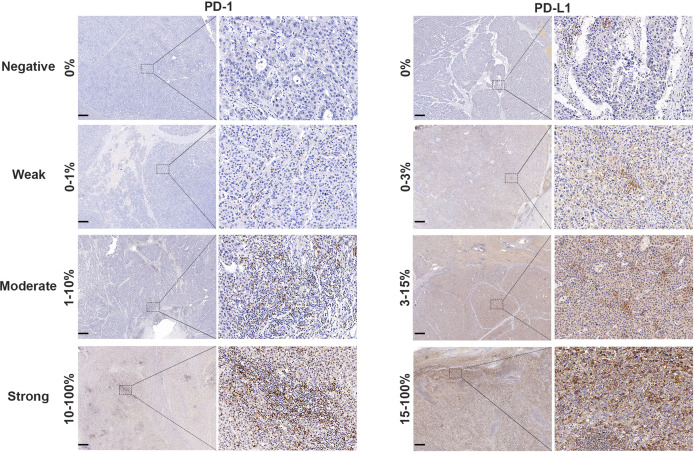
Figure 2.
PD-1 and PD-L1 expression in HCC tissue samples. Representative micrographs of PD-1 and PD-L1 expression within tumor (scalebar, 500 μm). The PD-1 status of tumor tissues was judged as negative (0%), weak (0–1%), moderate (1–10%) or strong (10–100%) according to the positive proportion of PD-1 in immune cells. The PD-L1 status of tumor tissues was classified as negative (0%), weak (0–3%), medium (3–15%) or strong (15–100%) based on the positive proportion of PD-L1 in tumor cells.

