Figure 2.
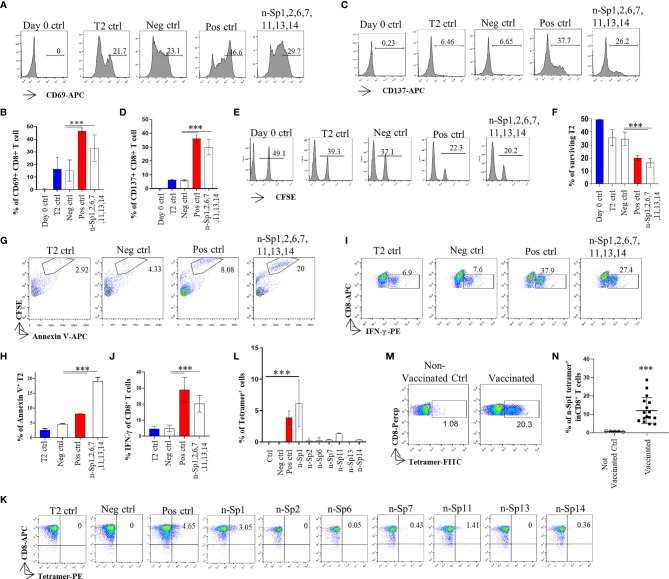
Activation of CD8+ T cell by peptides on SARS-CoV-2 Spike protein. (A, B) Mitomycin pretreated T2 cells were loaded with n-Sp1, 2, 6, 7, 11, 13, and 14 peptides and incubated with CD8+ T cell from healthy donors at a 1:1 ratio. Activation, cytotoxicity, and generation of epitope-specific CD8+ T cells were evaluated. Expression level of the T-cell activation marker CD69 was evaluated with flow cytometry after 16 h of stimulation. (B) Values indicate the percentage of CD69+CD8+ T cells, n = 3. (C, D) Expression level of the T-cell activation marker CD137 was evaluated with flow cytometry after 16 h stimulation. (D) Values indicate the percentage of CD137+CD8+ T cells. n = 3. (E, F) Epitope-specific CD8+ T-cell-mediated cytotoxicity was evaluated after 7 days of culture. The remaining CFSE-labeled T2 cells were calculated as survived target cells. (F) Values indicate the percentage of surviving T2 cells, n = 3. Apoptosis of T2 cells after 7 days culture. (G, H) Epitope-stimulated T-cell-mediated T2 apoptosis was calculated as the proportion of CFSE+AnnexinV+ cells. (H) Values indicate the percentage of CFSE+Annexin V+ T cells, n = 3. (I, J) The expression of IFN-γ after epitope stimulation for 7 days. IFN-γ was measured with intracellular staining flow cytometry. (J) Values indicate the percentage of IFN-γ+CD8+ T cells, n = 6. (K, L) Epitope-specific CD8+ T-cell generation after 7 days of stimulation. Stimulated CD8+ T cells were stained with given epitope-based tetramer and measured with flow cytometry. (L) Values indicate the percentage of tetramer+ cells, n = 5. Day 0 ctrl: staining before stimulation; T2 ctrl: T2 without peptide loading; Pos ctrl: positive control, T2 loaded with influenza A M1 peptide M58-66 GILGFVFTL. Neg ctrl, negative control; T2 loaded with Zika virus P30-38 GLQRLGYVL peptides. (M, N) A representative dot plot showing the measurement of peptide specific CD8+ T cells in HLA-A2+ non-vaccinated and vaccinated donors by flow cytometry. (N) Values indicate the percentage of n-Sp1 tetramer+CD8+ T cells, n = 5 of non-vaccinated donors and n = 16 of vaccinated donors. The data are represented as the mean ± SD in three independence experiments, ***p ≤ 0.001.

