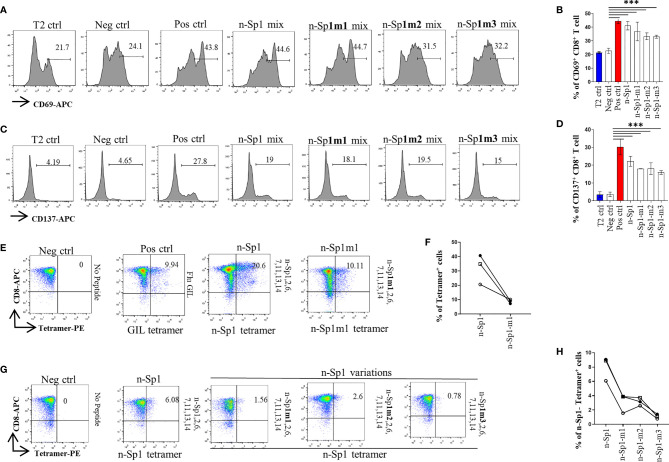
Figure 4.
Comparison of T-cell activation and function by n-Sp1 mutants. (A–D) Mitomycin pretreated T2 cells were loaded with n-Sp2, 6, 7, 11, 13, 14, plus n-Sp1 (n-Sp1 mix), n-Sp1m1 (n-Sp1m1 mix), n-Sp1m2 (n-Sp2 mix), or n-Sp1m3 (n-Sp3 mix) peptides, respectively. Next, pretreated T2 cells were co-cultured with CD8+ T cells from healthy donors at a 1:1 ratio. Expression level of T-cell activation marker CD69 and CD137 was evaluated with flow cytometry after 16 h of stimulation. (A, C) are the representative plots of data in bar graphs (B, D), n = 4. Generation of n-Sp1- and n-Sp1m1-specific CD8+ T cells in the same subjects. (E, F) The epitope-specific CD8+ T cells from the same subjects were measured with corresponding epitope peptide-based tetramer after 7 days of stimulation. (E) is the representative plot for (F). (G, H) The epitope simulation condition and tetramer information are labeled above and below the dot plot, respectively. n = 3. n-Sp1 tetramer could not recognize mutant-stimulated CD8+ T cells in the same subjects. n-Sp1 tetramer was used to stain n-Sp1 or n-Sp1 mutant peptide-stimulated CD8+ T cells from the same subjects after 7 days. (G) is the representative plot for (H). The epitope simulation condition and the tetramer information were labeled above and below the dot plot, respectively. n = 3. T2 ctrl: T2 cells without peptide loading; Neg ctrl: T2 cells loaded with Zika virus peptide P30-38 GLQRLGYVL; Pos ctrl: T2 cells loaded with influenza A M1 peptide M58-66 GILGFVFTL. The data are represented as the mean ± SD in three independence experiments, ***p ≤ 0.001.

