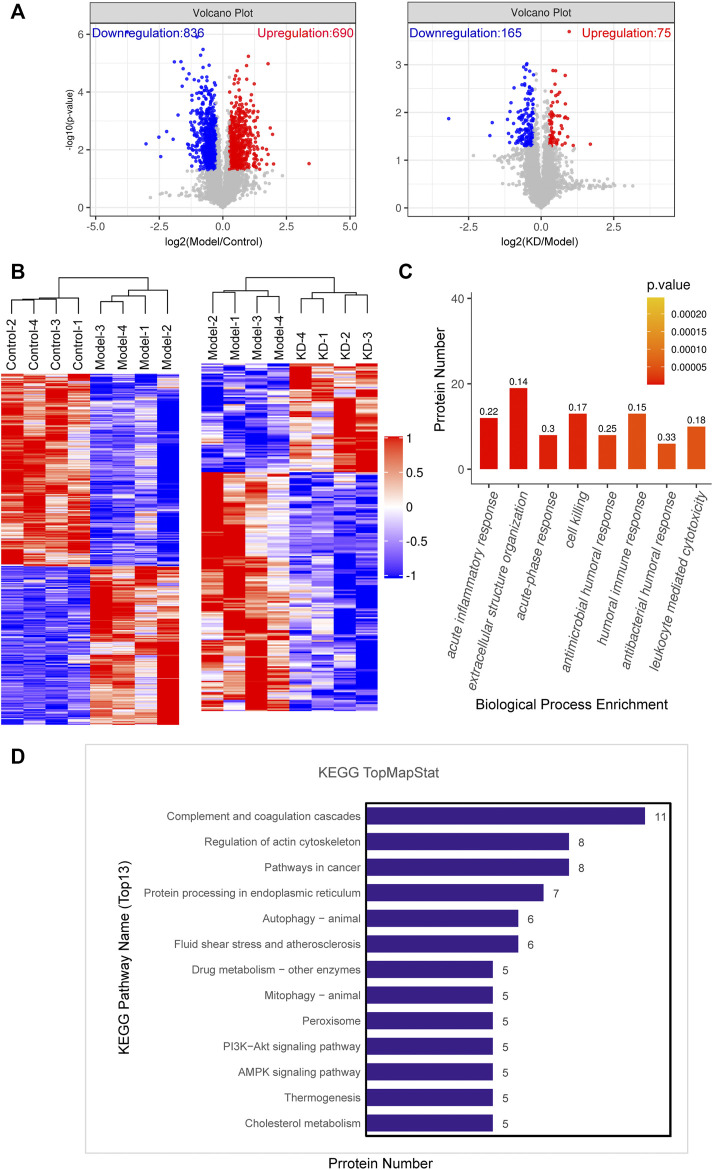
FIGURE 3.
Data from proteomic analysis of mice liver tissue. (A) Volcano plots of the number of differentially expressed proteins between the model and control groups and the KD and model groups. (B) Cluster analysis of the differentially expressed proteins in the control, model, and KD-treated groups of mice. (C) Biological process classification of GO functional enrichment histogram between the KD and model groups. The numbers on the histogram represent rich factor. The rich factor represents the ratio of the number of differentially expressed proteins annotated to a GO functional category to the number of all identified proteins annotated to the GO functional category. (D) KEGG pathway annotation of the top 13 differentially expressed proteins between the KD and model groups. (n = 4).

