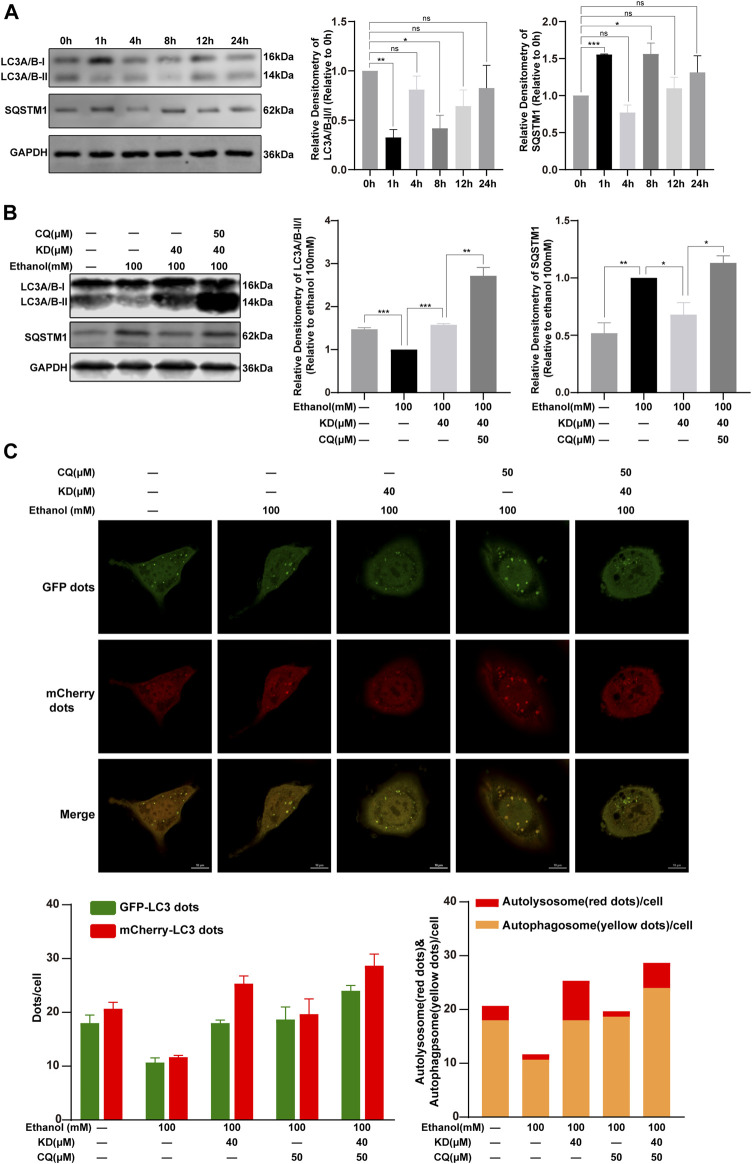
FIGURE 8.
KD restores ethanol-suppressed autophagic flux. (A) The effect of 100 mM ethanol for different time on autophagy. (B) KD affect the autophagy of ethanol in cells. (C) Confocal fluorescence image and analysis of KD promoting the recovery of autophagic flux. Red puncta represent autolysosomes, yellow puncta (merged by red and green) represent autophagosomes. (n = 3). Data represent the mean ± SEM. GAPDH was used as a loading control. ns, not significant. *p < 0.05, **p < 0.01, ***p < 0.001. Scale bar: 10 µm.

