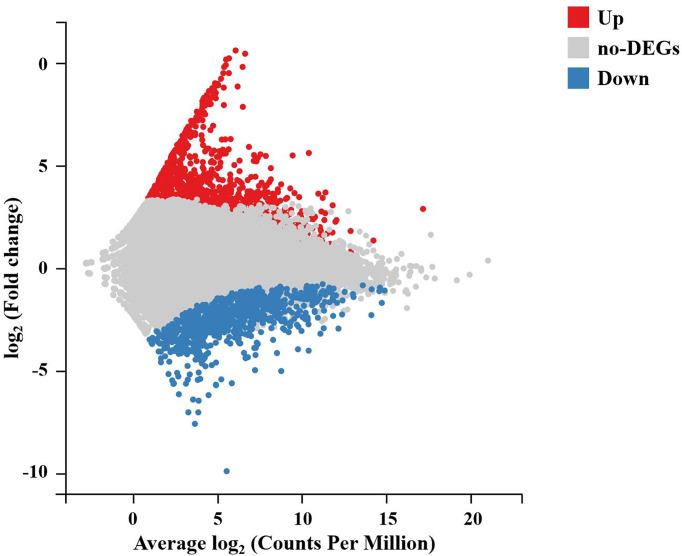
Figure 3.
M-versus-A plot (MA plot) between DEGs of the DIV1-infected and negative control Marsupenaeus japonicus intestines. The x-axis indicates the average expression level, and the y-axis indicates the fold change. Red dots represent the significantly upregulated DEGs, while blue dots represent the significantly downregulated DEGs (Q-value < 0.05 and |log2(fold change)| > 1). Gray dots represent the DEGs that were not significantly different. DEGs, differentially expressed genes; DIV1, decapod iridescent virus 1.

