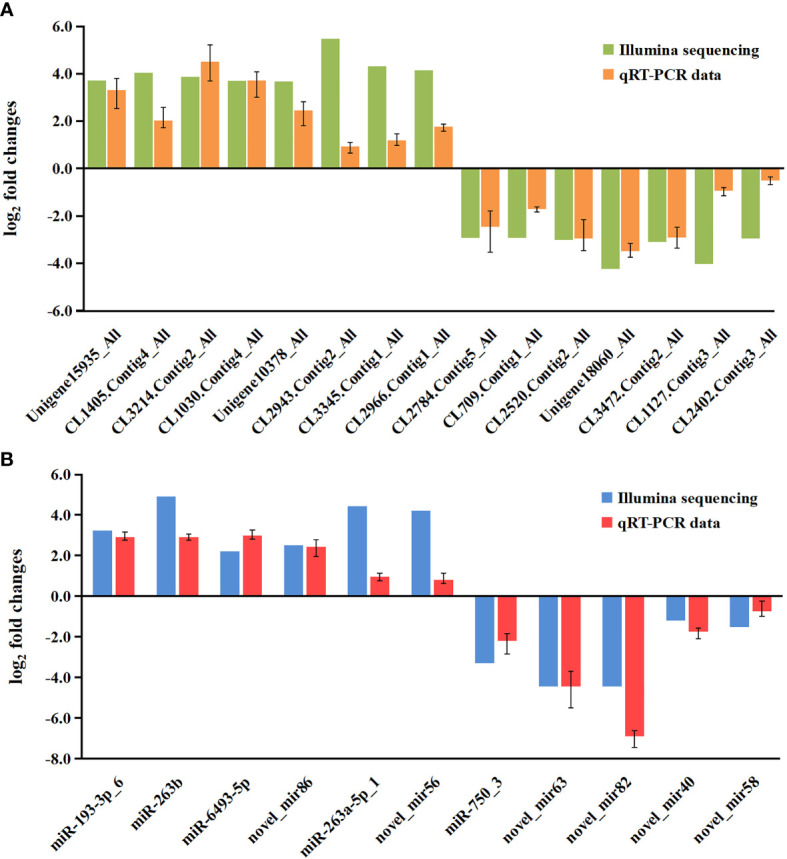
Figure 7.

Validation of RNA-seq results via qRT-PCR. (A) Comparison of the expression profiles of 10 DEGs as determined by Illumina sequencing and qRT-PCR. The x-axis indicates the names of the DEGs, and the y-axis represents the log2(fold change). (B) Comparison of the expression profiles of 8 DEMs as determined by Illumina sequencing and qRT-PCR. The x-axis indicates the names of the DEMs, and the y-axis represents the log2(fold change). DEGs, differentially expressed genes.
