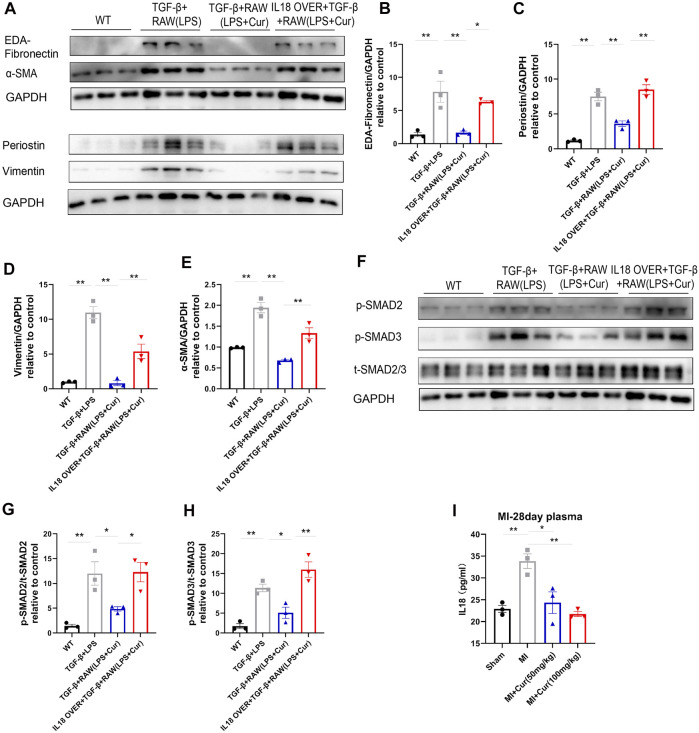
FIGURE 6.
IL-18 compensation represses curcumin-induced inhibition of SMAD2/3 phosphorylation and fibrotic gene expression (A–E). Fibrotic protein expression in different NRCF groups (WT, TGF-β+RAW (LPS), TGF-β+RAW (LPS + Cur), IL18 over + TGF-β+RAW (LPS + Cur)) respectively, fibrotic proteins are defined as EDA-Fibronectin, Periostin, Vimentin, and α-SMA. Summary data of protein expression are displayed in (B–E). EDA-Fibronectin is plotted in (B), Periostin is plotted in (C), Vimentin is plotted in (D) and α-SMA in (E) (F-H). Phosphorylation level of SMAD2/3 in different NRCF groups (WT, TGF-β+RAW (LPS), TGF-β+RAW (LPS + Cur), IL18 over + TGF-β+RAW (LPS + Cur)) identified by western blot is illustrated in (F). Summary data are plotted in (G) for p-SMAD2 and (H) for p-SMAD3 (I). IL-18 content in plasma from different groups (Sham, MI, MI + Cur 50 mg/kg, MI + Cur 100 mg/kg) were identified by ELISA kit, summary data are plotted. Results are mean with SEM, NS = no significance between groups, *p < 0.05, **p < 0.01.

