
Fig. 2.
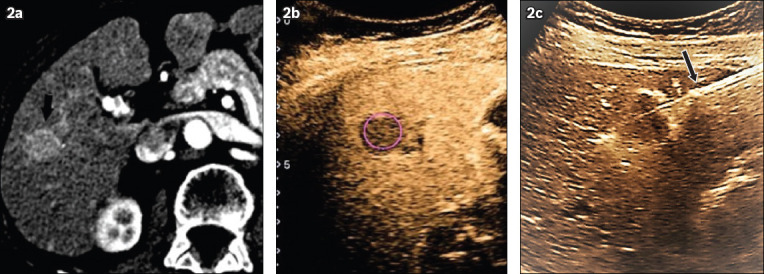
(a) Initial contrast-enhanced CT image shows enhancing tumour (arrow) during the arterial phase; (b) pCEUS image taken during the delayed Kupffer phase shows a classical Kupffer defect (circle); and (c) pCEUS image taken at about 30 minutes following the initial contrast injection shows the ablation probe (arrow) being placed through the tumour (visualised as the Kupffer defect). pCEUS: perfluorobutane contrast-enhanced ultrasonography