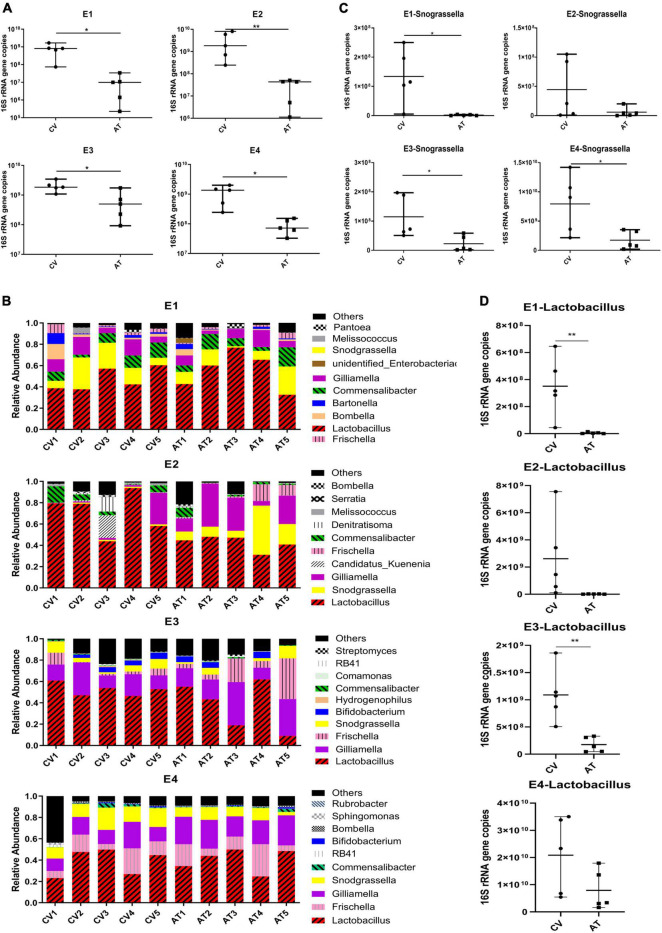
FIGURE 1.
Changes of honey bee gut microbiota after tetracycline treatment. (A) The absolute abundance of gut bacteria of CV and AT workers (n = 5), total bacterial 16S rRNA gene copies were estimated by qPCR. (B) Stacked column graph showing the relative abundance of bacterial species in CV and AT workers. (C) The absolute abundance of Snodgrassella in CV and AT workers (n = 5). (D) The absolute abundance of Lactobacillus in CV and AT workers (n = 5). *p < 0.05, **p < 0.01, student’s t-test. CV, conventional gut community workers, AT, Antibiotic treated workers.

