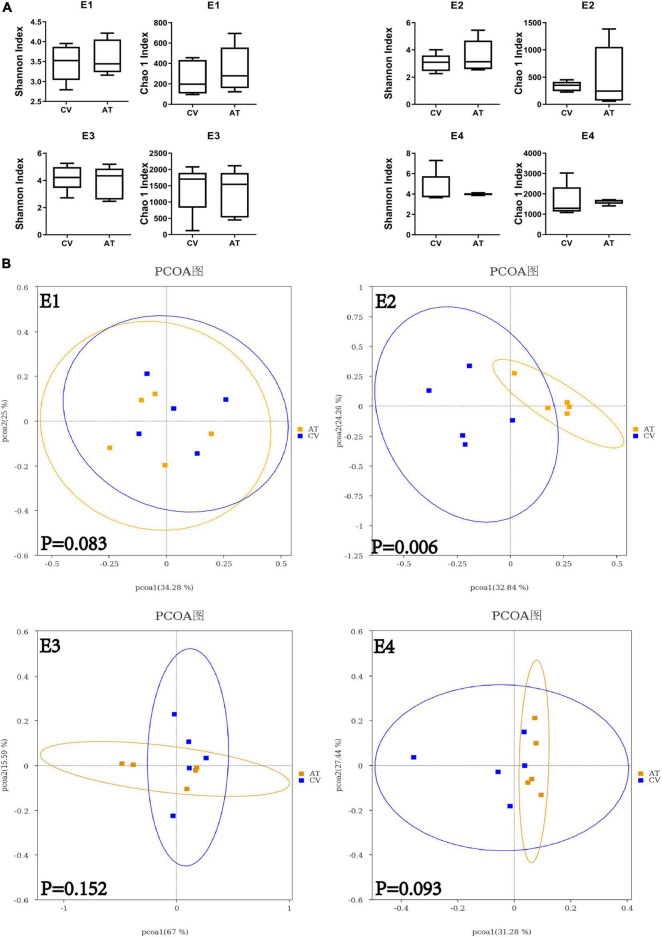
FIGURE 2.
Alpha and beta diversity of CV and AT honey bee workers. (A) Difference in alpha diversity between CV and AT workers measured using Shannon index and Chao 1 index. (B) The principal coordinate analysis (bray-Curtis) in gut community between CV and AT workers. E1–E4 represent four experimental replicates with four different honey bee colonies.

