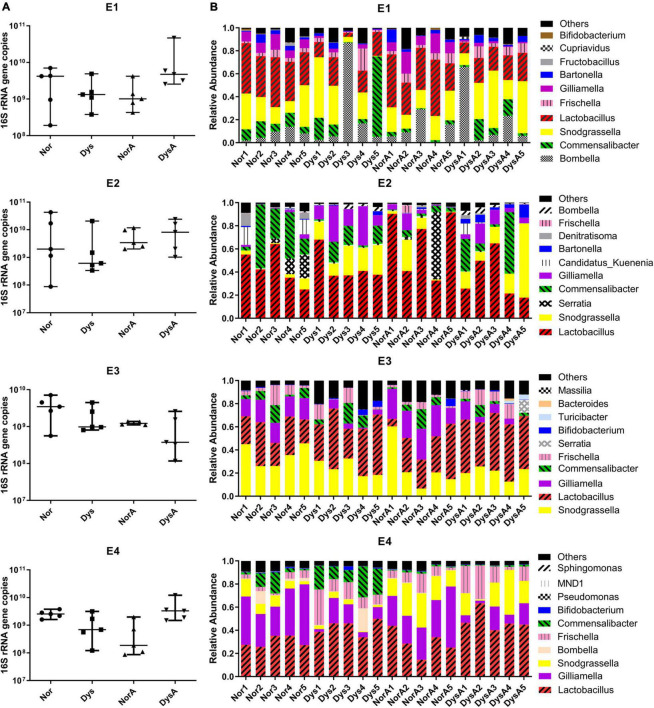
FIGURE 3.
Size and Composition of gut bacteria of Nor, Dys, NorA, and DysA honey bee workers. (A) The absolute abundance of gut bacteria of Nor, Dys, NorA and DysA workers (n = 5), total bacterial 16S rRNA gene copies were estimated by qPCR. (B) Stacked column graph showing the relative abundance of bacterial species in Nor, Dys, NorA, and DysA workers. Nor, workers colonized with normal gut community, Dys, workers colonized with dysbiotic gut community, NorA, workers colonized with normal gut community and treated with 10 μg/mL tetracycline, DysA, workers colonized with dysbiotic gut community and treated with 10 μg/mL tetracycline.

