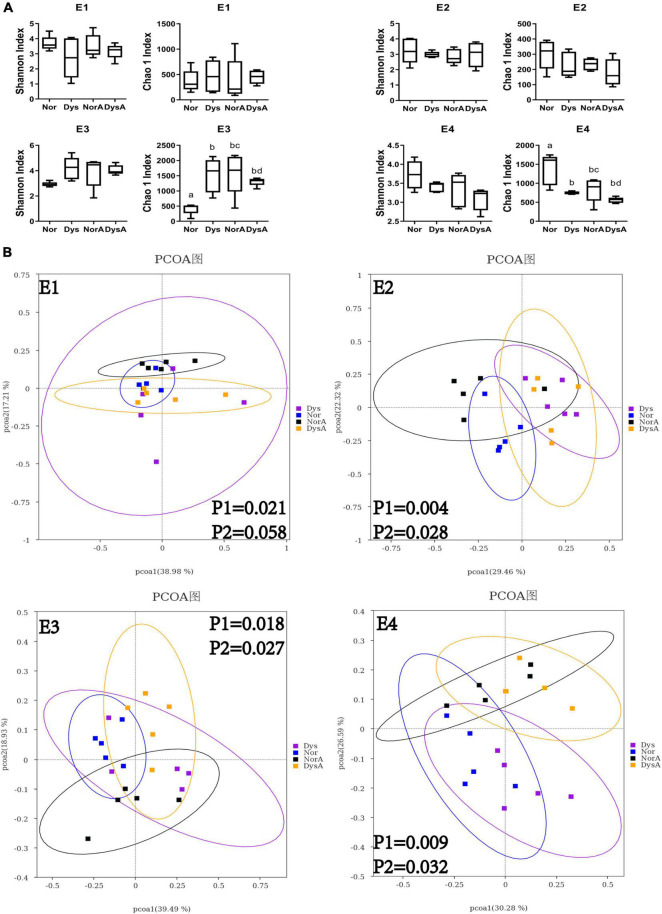
FIGURE 4.
Alpha and beta diversity of Nor, Dys, NorA and DysA honey bee workers. (A) Difference in alpha diversity between Nor, Dys, NorA and DysA workers measured using Shannon index and Chao 1 index. (B) The principal coordinate analysis (bray-Curtis) in gut community between Nor, Dys, NorA, and DysA workers. E1–E4 represent four experimental replicates with four different colonies.

