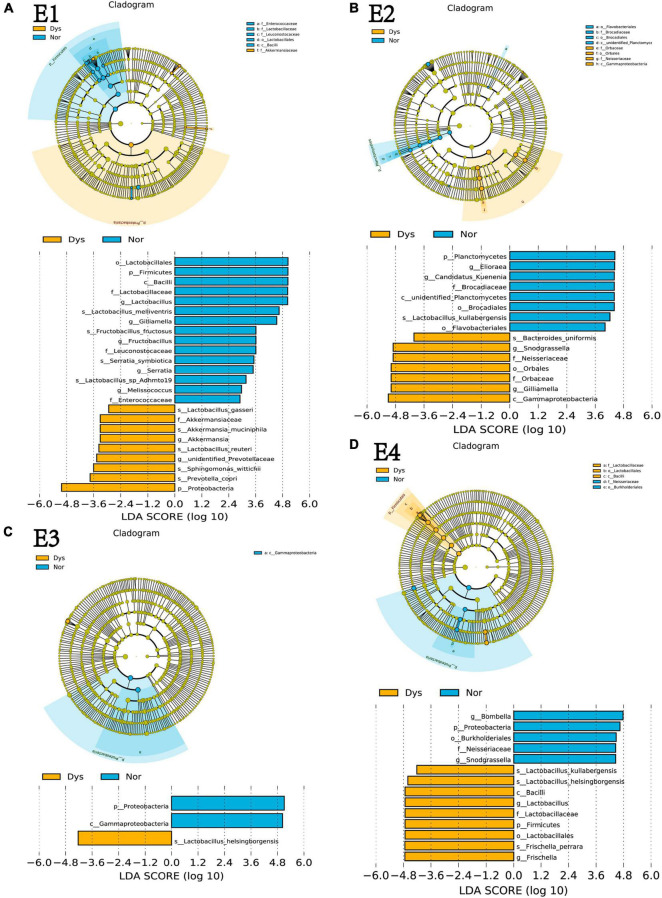
FIGURE 5.
The main taxa that were different in Nor vs Dys in E1 (A), E2 (B), E3 (C) and E3 (D) on the basis of LEFSe analysis (taxa with >4). Blue represents taxa that significantly higher in Nor bees and yellow represents taxa that significantly higher in Dys bees. E1–E4 represent four experimental replicates with different colony. Nor: workers colonized with normal gut community, Dys, workers colonized with dysbiotic gut community.

