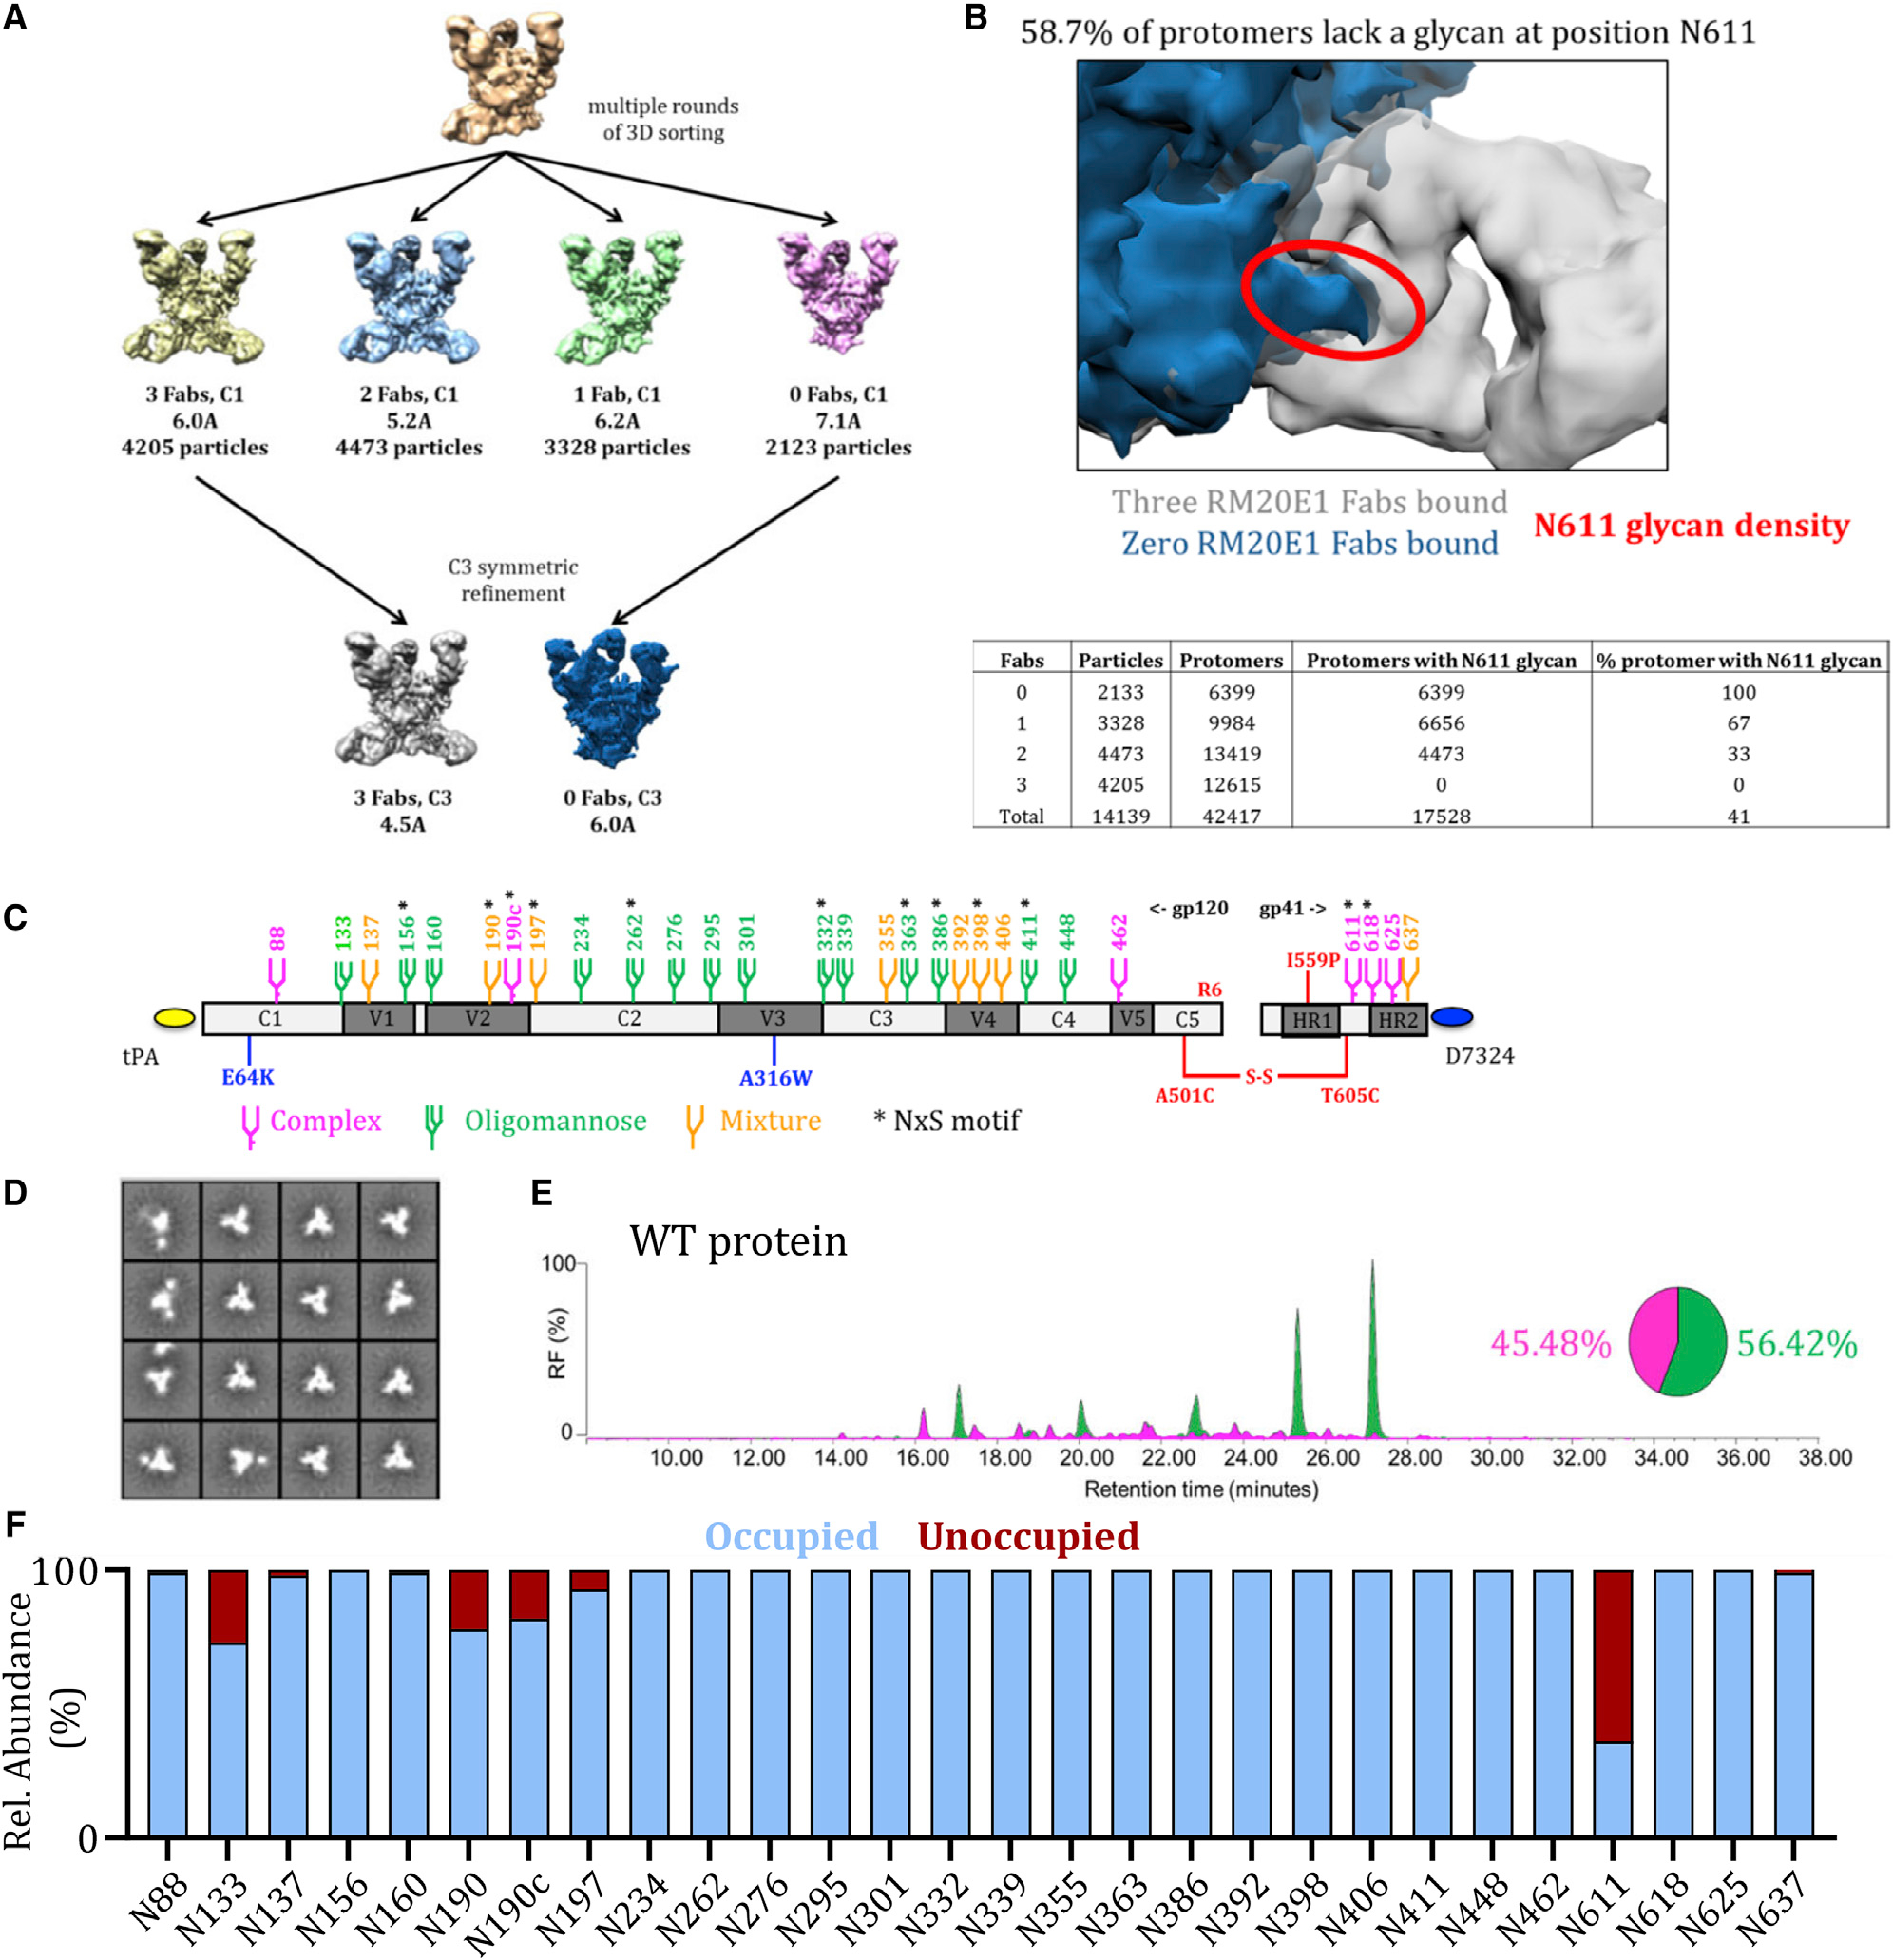
Figure 1. Several PNGS on BG505 SOSIP.v4.1 trimers are under-occupied.

(A) Cryo-EM analysis of WT proteins in complex with the RM20E1 Fab. Complexes were sorted based on the number of Fabs bound; the numbers of particles in each reconstruction are listed, as are the resolutions of the final reconstructions.
(B) Overlay of the Cryo-EM reconstructions of the BG505 SOSIP.664 trimer alone (in blue) and in complex with the RM20E1 Fab (in gray). The density of the N611 glycan (also in blue) on the trimer without RM20E1 is highlighted in red to illustrate clashes with the RM20E1 Fab (in gray). The total number of complexes with different numbers of Fab bound is indicated in the table, as are the protomers with N611 glycan density. From these numbers, the % of protomers that lack the N611 glycan could be calculated (~59%).
(C) Linear representation of the D7324-tagged BG505 SOSIP.v4.1 trimer. The SOSIP changes and the stabilizing E64K and A316W mutations are all highlighted (Sanders et al., 2013; de Taeye et al., 2015). The glycans are also indicated, with the amino acid numbering based on the HXB2 strain. Sites that are predominantly occupied by oligomannose species are colored green and by complex species in magenta, whereas orange indicates that either an oligomannose or a complex glycoform can be present, based on data presented in (D). An asterisk indicates that the PNGS is encoded by an NxS sequon.
(D) NS-EM analysis of WT proteins, showing the 2D class-averages.
E) HILIC-UPLC analysis of WT proteins. Peaks colored green represent glycans that can be cleaved by endoglycosidase H (endoH) and correspond to oligomannose or hybrid-type glycans. The HILIC-UPLC spectra and pie chart show the overall oligomannose glycan (green) and complex/hybrid glycan (magenta) content.
(F) Quantification of site-specific occupancy for all 28 PNGS on WT proteins, derived from LC-ESI MS analyses. Results are the mean of two independent biological replicates of the WT protein. The data displayed represents the relative proportion of occupied (blue) versus unoccupied (red). All the data in (A)–(F) were derived using WT proteins produced in HEK293F cells followed by PGT145-affinity purification. The corresponding data on WT proteins purified by the 2G12/SEC method are in Figure S1.
